
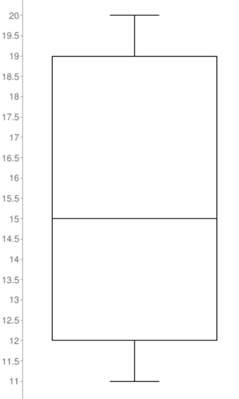
Tograph:A box and whisker plot for the set of values 12, 11, 15, 12, 19, 20, 19, 14, 18, 15, 16.
Given information:
The given set of values 12, 11, 15, 12, 19, 20, 19, 14, 18, 15, 16.
Graph:
Consider the given information.
Arrange the values in ascending order.
11, 12, 12, 14, 15, 15, 16, 18, 19, 19, 20
Median:
The given data has 11 observations which is odd so the median will be the middle value of the arranged data set. So, the median of the data is the data value at 6th position.
Hence the median of the data set is 15.
First quartile
The third
The required graph is shown below:
Interpretation:
The graph has minimum value 11 and maximum values 20.
Chapter 11 Solutions
High School Math 2015 Common Core Algebra 2 Student Edition Grades 10/11

 Algebra and Trigonometry (6th Edition)AlgebraISBN:9780134463216Author:Robert F. BlitzerPublisher:PEARSON
 Contemporary Abstract AlgebraAlgebraISBN:9781305657960Author:Joseph GallianPublisher:Cengage Learning
 Linear Algebra: A Modern IntroductionAlgebraISBN:9781285463247Author:David PoolePublisher:Cengage Learning
 Algebra And Trigonometry (11th Edition)AlgebraISBN:9780135163078Author:Michael SullivanPublisher:PEARSON
 Introduction to Linear Algebra, Fifth EditionAlgebraISBN:9780980232776Author:Gilbert StrangPublisher:Wellesley-Cambridge Press
 College Algebra (Collegiate Math)AlgebraISBN:9780077836344Author:Julie Miller, Donna GerkenPublisher:McGraw-Hill Education