
To explain: A situation that suits the probability distribution graph given.
The probability that a student misses a class on a day is 0.3 and the distribution is about the probability of a student missing the class in 3 days of school.
Given:
A graph of a probability distribution as shown below
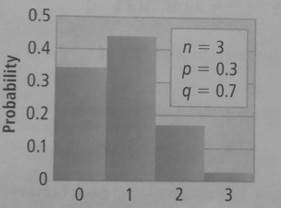
The total number of trails
The probability of success or student miss a class
The probability of failure or student does not miss class
Concept used:
The
Interpretation:From the given information
A situation where a student misses class on each day with a probability of 0.3 and the probability distribution for 3 days is being calculated. This is an apt situation for the given probability distribution.
The probabilities are calculated as shown below
Thus the probabilities with respect to the given graph are calculated and the given situation is an apt for the given probability graph.
Chapter 11 Solutions
High School Math 2015 Common Core Algebra 2 Student Edition Grades 10/11

 Algebra and Trigonometry (6th Edition)AlgebraISBN:9780134463216Author:Robert F. BlitzerPublisher:PEARSON
 Contemporary Abstract AlgebraAlgebraISBN:9781305657960Author:Joseph GallianPublisher:Cengage Learning
 Linear Algebra: A Modern IntroductionAlgebraISBN:9781285463247Author:David PoolePublisher:Cengage Learning
 Algebra And Trigonometry (11th Edition)AlgebraISBN:9780135163078Author:Michael SullivanPublisher:PEARSON
 Introduction to Linear Algebra, Fifth EditionAlgebraISBN:9780980232776Author:Gilbert StrangPublisher:Wellesley-Cambridge Press
 College Algebra (Collegiate Math)AlgebraISBN:9780077836344Author:Julie Miller, Donna GerkenPublisher:McGraw-Hill Education