
High School Math 2015 Common Core Algebra 2 Student Edition Grades 10/11
15th Edition
ISBN: 9780133281163
Author: Prentice Hall
Publisher: Prentice Hall
expand_more
expand_more
format_list_bulleted
Expert Solution & Answer
Chapter 11.7, Problem 29PPSE
Solution
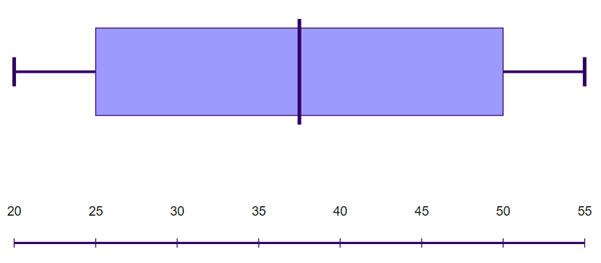
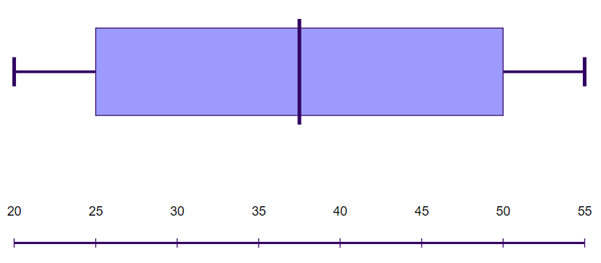
To find: To make a box-and-whisker plot for each set of values.
The box-and-whisker plot for the given data is:
Given information:
Given dataset is:
Calculation:
The given data is in ascending order.
The minimum and maximum values are 20 and 55.
The number of values given is 10 i.e., even number of values. So, the median is given by:
Hence
The two halves on either sides of the median are
Medians of the first and second halves are
Making a box-and-whisker plot from the above data:

Conclusion:
The box-and-whisker plot for the given data is:
Chapter 11 Solutions
High School Math 2015 Common Core Algebra 2 Student Edition Grades 10/11
Ch. 11.1 - Prob. 1LCCh. 11.1 - Prob. 2LCCh. 11.1 - Prob. 3LCCh. 11.1 - Prob. 4LCCh. 11.1 - Prob. 5LCCh. 11.1 - Prob. 6LCCh. 11.1 - Prob. 7LCCh. 11.1 - Prob. 8LCCh. 11.1 - Prob. 9PPSECh. 11.1 - Prob. 10PPSE
Ch. 11.1 - Prob. 11PPSECh. 11.1 - Prob. 12PPSECh. 11.1 - Prob. 13PPSECh. 11.1 - Prob. 14PPSECh. 11.1 - Prob. 15PPSECh. 11.1 - Prob. 16PPSECh. 11.1 - Prob. 17PPSECh. 11.1 - Prob. 18PPSECh. 11.1 - Prob. 19PPSECh. 11.1 - Prob. 20PPSECh. 11.1 - Prob. 21PPSECh. 11.1 - Prob. 22PPSECh. 11.1 - Prob. 23PPSECh. 11.1 - Prob. 24PPSECh. 11.1 - Prob. 25PPSECh. 11.1 - Prob. 26PPSECh. 11.1 - Prob. 27PPSECh. 11.1 - Prob. 28PPSECh. 11.1 - Prob. 29PPSECh. 11.1 - Prob. 30PPSECh. 11.1 - Prob. 31PPSECh. 11.1 - Prob. 32PPSECh. 11.1 - Prob. 33PPSECh. 11.1 - Prob. 34PPSECh. 11.1 - Prob. 35PPSECh. 11.1 - Prob. 36PPSECh. 11.1 - Prob. 37PPSECh. 11.1 - Prob. 38PPSECh. 11.1 - Prob. 39PPSECh. 11.1 - Prob. 40PPSECh. 11.1 - Prob. 41PPSECh. 11.1 - Prob. 42PPSECh. 11.1 - Prob. 43PPSECh. 11.1 - Prob. 44PPSECh. 11.1 - Prob. 45PPSECh. 11.1 - Prob. 46PPSECh. 11.1 - Prob. 47PPSECh. 11.1 - Prob. 48PPSECh. 11.1 - Prob. 49PPSECh. 11.1 - Prob. 50PPSECh. 11.1 - Prob. 51PPSECh. 11.1 - Prob. 52PPSECh. 11.1 - Prob. 53PPSECh. 11.1 - Prob. 54PPSECh. 11.1 - Prob. 55PPSECh. 11.1 - Prob. 56PPSECh. 11.1 - Prob. 57PPSECh. 11.1 - Prob. 58PPSECh. 11.1 - Prob. 59PPSECh. 11.1 - Prob. 60PPSECh. 11.1 - Prob. 61PPSECh. 11.1 - Prob. 62PPSECh. 11.1 - Prob. 63PPSECh. 11.1 - Prob. 64PPSECh. 11.1 - Prob. 65PPSECh. 11.1 - Prob. 66PPSECh. 11.1 - Prob. 67PPSECh. 11.1 - Prob. 68PPSECh. 11.2 - Prob. 1LCCh. 11.2 - Prob. 2LCCh. 11.2 - Prob. 3LCCh. 11.2 - Prob. 4LCCh. 11.2 - Prob. 5LCCh. 11.2 - Prob. 6LCCh. 11.2 - Prob. 7LCCh. 11.2 - Prob. 8PPSECh. 11.2 - Prob. 9PPSECh. 11.2 - Prob. 10PPSECh. 11.2 - Prob. 11PPSECh. 11.2 - Prob. 12PPSECh. 11.2 - Prob. 13PPSECh. 11.2 - Prob. 14PPSECh. 11.2 - Prob. 15PPSECh. 11.2 - Prob. 16PPSECh. 11.2 - Prob. 17PPSECh. 11.2 - Prob. 18PPSECh. 11.2 - Prob. 19PPSECh. 11.2 - Prob. 20PPSECh. 11.2 - Prob. 21PPSECh. 11.2 - Prob. 22PPSECh. 11.2 - Prob. 23PPSECh. 11.2 - Prob. 24PPSECh. 11.2 - Prob. 25PPSECh. 11.2 - Prob. 26PPSECh. 11.2 - Prob. 27PPSECh. 11.2 - Prob. 28PPSECh. 11.2 - Prob. 29PPSECh. 11.2 - Prob. 30PPSECh. 11.2 - Prob. 31PPSECh. 11.2 - Prob. 32PPSECh. 11.2 - Prob. 33PPSECh. 11.2 - Prob. 34PPSECh. 11.2 - Prob. 35PPSECh. 11.2 - Prob. 36PPSECh. 11.3 - Prob. 1LCCh. 11.3 - Prob. 2LCCh. 11.3 - Prob. 3LCCh. 11.3 - Prob. 4LCCh. 11.3 - Prob. 5LCCh. 11.3 - Prob. 6LCCh. 11.3 - Prob. 7LCCh. 11.3 - Prob. 8LCCh. 11.3 - Prob. 9PPSECh. 11.3 - Prob. 10PPSECh. 11.3 - Prob. 11PPSECh. 11.3 - Prob. 12PPSECh. 11.3 - Prob. 13PPSECh. 11.3 - Prob. 14PPSECh. 11.3 - Prob. 15PPSECh. 11.3 - Prob. 16PPSECh. 11.3 - Prob. 17PPSECh. 11.3 - Prob. 18PPSECh. 11.3 - Prob. 19PPSECh. 11.3 - Prob. 20PPSECh. 11.3 - Prob. 21PPSECh. 11.3 - Prob. 22PPSECh. 11.3 - Prob. 23PPSECh. 11.3 - Prob. 24PPSECh. 11.3 - Prob. 25PPSECh. 11.3 - Prob. 26PPSECh. 11.3 - Prob. 27PPSECh. 11.3 - Prob. 28PPSECh. 11.3 - Prob. 29PPSECh. 11.3 - Prob. 30PPSECh. 11.3 - Prob. 31PPSECh. 11.3 - Prob. 32PPSECh. 11.3 - Prob. 33PPSECh. 11.3 - Prob. 34PPSECh. 11.3 - Prob. 35PPSECh. 11.3 - Prob. 36PPSECh. 11.3 - Prob. 37PPSECh. 11.3 - Prob. 38PPSECh. 11.3 - Prob. 39PPSECh. 11.3 - Prob. 40PPSECh. 11.3 - Prob. 41PPSECh. 11.3 - Prob. 42PPSECh. 11.3 - Prob. 43PPSECh. 11.3 - Prob. 44PPSECh. 11.3 - Prob. 45PPSECh. 11.3 - Prob. 46PPSECh. 11.3 - Prob. 47PPSECh. 11.3 - Prob. 48PPSECh. 11.3 - Prob. 49PPSECh. 11.3 - Prob. 50PPSECh. 11.3 - Prob. 51PPSECh. 11.3 - Prob. 52PPSECh. 11.3 - Prob. 53PPSECh. 11.3 - Prob. 54PPSECh. 11.3 - Prob. 55PPSECh. 11.3 - Prob. 56PPSECh. 11.3 - Prob. 57PPSECh. 11.3 - Prob. 58PPSECh. 11.3 - Prob. 59PPSECh. 11.3 - Prob. 60PPSECh. 11.3 - Prob. 61PPSECh. 11.3 - Prob. 62PPSECh. 11.3 - Prob. 1ACh. 11.3 - Prob. 2ACh. 11.3 - Prob. 3ACh. 11.3 - Prob. 4ACh. 11.3 - Prob. 5ACh. 11.3 - Prob. 6ACh. 11.3 - Prob. 7ACh. 11.3 - Prob. 8ECh. 11.3 - Prob. 9ECh. 11.4 - Prob. 1LCCh. 11.4 - Prob. 2LCCh. 11.4 - Prob. 3LCCh. 11.4 - Prob. 4LCCh. 11.4 - Prob. 5LCCh. 11.4 - Prob. 6LCCh. 11.4 - Prob. 7LCCh. 11.4 - Prob. 8PPSECh. 11.4 - Prob. 9PPSECh. 11.4 - Prob. 10PPSECh. 11.4 - Prob. 11PPSECh. 11.4 - Prob. 12PPSECh. 11.4 - Prob. 13PPSECh. 11.4 - Prob. 14PPSECh. 11.4 - Prob. 15PPSECh. 11.4 - Prob. 16PPSECh. 11.4 - Prob. 17PPSECh. 11.4 - Prob. 18PPSECh. 11.4 - Prob. 19PPSECh. 11.4 - Prob. 20PPSECh. 11.4 - Prob. 21PPSECh. 11.4 - Prob. 22PPSECh. 11.4 - Prob. 23PPSECh. 11.4 - Prob. 24PPSECh. 11.4 - Prob. 25PPSECh. 11.4 - Prob. 26PPSECh. 11.4 - Prob. 27PPSECh. 11.4 - Prob. 28PPSECh. 11.4 - Prob. 29PPSECh. 11.4 - Prob. 30PPSECh. 11.4 - Prob. 31PPSECh. 11.4 - Prob. 32PPSECh. 11.4 - Prob. 33PPSECh. 11.5 - Prob. 1LCCh. 11.5 - Prob. 2LCCh. 11.5 - Prob. 3LCCh. 11.5 - Prob. 4LCCh. 11.5 - Prob. 5LCCh. 11.5 - Prob. 6PPSECh. 11.5 - Prob. 7PPSECh. 11.5 - Prob. 8PPSECh. 11.5 - Prob. 9PPSECh. 11.5 - Prob. 10PPSECh. 11.5 - Prob. 11PPSECh. 11.5 - Prob. 12PPSECh. 11.5 - Prob. 13PPSECh. 11.5 - Prob. 14PPSECh. 11.5 - Prob. 15PPSECh. 11.5 - Prob. 16PPSECh. 11.5 - Prob. 17PPSECh. 11.5 - Prob. 18PPSECh. 11.6 - Prob. 1LCCh. 11.6 - Prob. 2LCCh. 11.6 - Prob. 3LCCh. 11.6 - Prob. 4LCCh. 11.6 - Prob. 5LCCh. 11.6 - Prob. 6LCCh. 11.6 - Prob. 7PPSECh. 11.6 - Prob. 8PPSECh. 11.6 - Prob. 9PPSECh. 11.6 - Prob. 10PPSECh. 11.6 - Prob. 11PPSECh. 11.6 - Prob. 12PPSECh. 11.6 - Prob. 13PPSECh. 11.6 - Prob. 14PPSECh. 11.6 - Prob. 15PPSECh. 11.6 - Prob. 16PPSECh. 11.6 - Prob. 17PPSECh. 11.6 - Prob. 18PPSECh. 11.6 - Prob. 19PPSECh. 11.6 - Prob. 20PPSECh. 11.6 - Prob. 21PPSECh. 11.6 - Prob. 22PPSECh. 11.6 - Prob. 23PPSECh. 11.6 - Prob. 24PPSECh. 11.6 - Prob. 25PPSECh. 11.6 - Prob. 26PPSECh. 11.6 - Prob. 27PPSECh. 11.6 - Prob. 28PPSECh. 11.6 - Prob. 29PPSECh. 11.6 - Prob. 30PPSECh. 11.6 - Prob. 31PPSECh. 11.6 - Prob. 32PPSECh. 11.6 - Prob. 33PPSECh. 11.6 - Prob. 34PPSECh. 11.6 - Prob. 35PPSECh. 11.6 - Prob. 36PPSECh. 11.6 - Prob. 37PPSECh. 11.6 - Prob. 38PPSECh. 11.6 - Prob. 39PPSECh. 11.6 - Prob. 40PPSECh. 11.6 - Prob. 41PPSECh. 11.6 - Prob. 42PPSECh. 11.6 - Prob. 43PPSECh. 11.7 - Prob. 1LCCh. 11.7 - Prob. 2LCCh. 11.7 - Prob. 3LCCh. 11.7 - Prob. 4LCCh. 11.7 - Prob. 5LCCh. 11.7 - Prob. 6PPSECh. 11.7 - Prob. 7PPSECh. 11.7 - Prob. 8PPSECh. 11.7 - Prob. 9PPSECh. 11.7 - Prob. 10PPSECh. 11.7 - Prob. 11PPSECh. 11.7 - Prob. 12PPSECh. 11.7 - Prob. 13PPSECh. 11.7 - Prob. 14PPSECh. 11.7 - Prob. 15PPSECh. 11.7 - Prob. 16PPSECh. 11.7 - Prob. 17PPSECh. 11.7 - Prob. 18PPSECh. 11.7 - Prob. 20PPSECh. 11.7 - Prob. 21PPSECh. 11.7 - Prob. 22PPSECh. 11.7 - Prob. 23PPSECh. 11.7 - Prob. 24PPSECh. 11.7 - Prob. 25PPSECh. 11.7 - Prob. 26PPSECh. 11.7 - Prob. 27PPSECh. 11.7 - Prob. 28PPSECh. 11.7 - Prob. 29PPSECh. 11.7 - Prob. 30PPSECh. 11.7 - Prob. 31PPSECh. 11.7 - Prob. 32PPSECh. 11.7 - Prob. 33PPSECh. 11.7 - Prob. 34PPSECh. 11.7 - Prob. 35PPSECh. 11.7 - Prob. 36PPSECh. 11.7 - Prob. 37PPSECh. 11.8 - Prob. 1LCCh. 11.8 - Prob. 2LCCh. 11.8 - Prob. 3LCCh. 11.8 - Prob. 4LCCh. 11.8 - Prob. 5LCCh. 11.8 - Prob. 6PPSECh. 11.8 - Prob. 7PPSECh. 11.8 - Prob. 8PPSECh. 11.8 - Prob. 9PPSECh. 11.8 - Prob. 10PPSECh. 11.8 - Prob. 11PPSECh. 11.8 - Prob. 12PPSECh. 11.8 - Prob. 13PPSECh. 11.8 - Prob. 14PPSECh. 11.8 - Prob. 15PPSECh. 11.8 - Prob. 16PPSECh. 11.8 - Prob. 17PPSECh. 11.8 - Prob. 18PPSECh. 11.8 - Prob. 19PPSECh. 11.8 - Prob. 20PPSECh. 11.8 - Prob. 21PPSECh. 11.8 - Prob. 22PPSECh. 11.8 - Prob. 23PPSECh. 11.8 - Prob. 24PPSECh. 11.8 - Prob. 25PPSECh. 11.8 - Prob. 26PPSECh. 11.8 - Prob. 27PPSECh. 11.8 - Prob. 28PPSECh. 11.8 - Prob. 29PPSECh. 11.8 - Prob. 30PPSECh. 11.8 - Prob. 31PPSECh. 11.8 - Prob. 32PPSECh. 11.8 - Prob. 33PPSECh. 11.8 - Prob. 34PPSECh. 11.8 - Prob. 35PPSECh. 11.8 - Prob. 36PPSECh. 11.8 - Prob. 37PPSECh. 11.8 - Prob. 38PPSECh. 11.9 - Prob. 1LCCh. 11.9 - Prob. 2LCCh. 11.9 - Prob. 3LCCh. 11.9 - Prob. 4LCCh. 11.9 - Prob. 5LCCh. 11.9 - Prob. 6LCCh. 11.9 - Prob. 7LCCh. 11.9 - Prob. 8PPSECh. 11.9 - Prob. 9PPSECh. 11.9 - Prob. 10PPSECh. 11.9 - Prob. 11PPSECh. 11.9 - Prob. 12PPSECh. 11.9 - Prob. 13PPSECh. 11.9 - Prob. 14PPSECh. 11.9 - Prob. 15PPSECh. 11.9 - Prob. 16PPSECh. 11.9 - Prob. 17PPSECh. 11.9 - Prob. 18PPSECh. 11.9 - Prob. 19PPSECh. 11.9 - Prob. 20PPSECh. 11.9 - Prob. 21PPSECh. 11.9 - Prob. 22PPSECh. 11.9 - Prob. 23PPSECh. 11.9 - Prob. 24PPSECh. 11.9 - Prob. 25PPSECh. 11.9 - Prob. 26PPSECh. 11.9 - Prob. 27PPSECh. 11.9 - Prob. 28PPSECh. 11.9 - Prob. 29PPSECh. 11.9 - Prob. 30PPSECh. 11.9 - Prob. 31PPSECh. 11.9 - Prob. 32PPSECh. 11.9 - Prob. 33PPSECh. 11.9 - Prob. 34PPSECh. 11.9 - Prob. 35PPSECh. 11.9 - Prob. 36PPSECh. 11.9 - Prob. 37PPSECh. 11.9 - Prob. 38PPSECh. 11.9 - Prob. 39PPSECh. 11.9 - Prob. 40PPSECh. 11.9 - Prob. 42PPSECh. 11.9 - Prob. 43PPSECh. 11.9 - Prob. 44PPSECh. 11.9 - Prob. 45PPSECh. 11.9 - Prob. 46PPSECh. 11.9 - Prob. 47PPSECh. 11.9 - Prob. 48PPSECh. 11.9 - Prob. 49PPSECh. 11.9 - Prob. 50PPSECh. 11.9 - Prob. 51PPSECh. 11.9 - Prob. 52PPSECh. 11.9 - Prob. 53PPSECh. 11.9 - Prob. 54PPSECh. 11.9 - Prob. 55PPSECh. 11.9 - Prob. 56PPSECh. 11.9 - Prob. 57PPSECh. 11.9 - Prob. 58PPSECh. 11.9 - Prob. 59PPSECh. 11.9 - Prob. 60PPSECh. 11.10 - Prob. 1LCCh. 11.10 - Prob. 2LCCh. 11.10 - Prob. 3LCCh. 11.10 - Prob. 4LCCh. 11.10 - Prob. 5LCCh. 11.10 - Prob. 6LCCh. 11.10 - Prob. 7PPSECh. 11.10 - Prob. 8PPSECh. 11.10 - Prob. 9PPSECh. 11.10 - Prob. 10PPSECh. 11.10 - Prob. 11PPSECh. 11.10 - Prob. 12PPSECh. 11.10 - Prob. 13PPSECh. 11.10 - Prob. 14PPSECh. 11.10 - Prob. 15PPSECh. 11.10 - Prob. 16PPSECh. 11.10 - Prob. 17PPSECh. 11.10 - Prob. 18PPSECh. 11.10 - Prob. 19PPSECh. 11.10 - Prob. 20PPSECh. 11.10 - Prob. 21PPSECh. 11.10 - Prob. 22PPSECh. 11.10 - Prob. 23PPSECh. 11.10 - Prob. 24PPSECh. 11.10 - Prob. 25PPSECh. 11.10 - Prob. 26PPSECh. 11.10 - Prob. 27PPSECh. 11.10 - Prob. 28PPSECh. 11.10 - Prob. 29PPSECh. 11.10 - Prob. 30PPSECh. 11.10 - Prob. 31PPSECh. 11.10 - Prob. 32PPSECh. 11.10 - Prob. 33PPSECh. 11.10 - Prob. 34PPSECh. 11.10 - Prob. 35PPSECh. 11.10 - Prob. 36PPSECh. 11.10 - Prob. 37PPSECh. 11.10 - Prob. 38PPSECh. 11.10 - Prob. 39PPSECh. 11.10 - Prob. 40PPSECh. 11.10 - Prob. 41PPSECh. 11.10 - Prob. 42PPSECh. 11.10 - Prob. 43PPSECh. 11.10 - Prob. 44PPSECh. 11.10 - Prob. 45PPSECh. 11.10 - Prob. 46PPSECh. 11.10 - Prob. 1ACh. 11.10 - Prob. 2ACh. 11.10 - Prob. 3ACh. 11.10 - Prob. 4ACh. 11.10 - Prob. 5ACh. 11.10 - Prob. 6ACh. 11.10 - Prob. 7ACh. 11.10 - Prob. 8ACh. 11.10 - Prob. 9ECh. 11.10 - Prob. 10ECh. 11.10 - Prob. 1.1ACh. 11.10 - Prob. 1.2ACh. 11.10 - Prob. 1.3ACh. 11.10 - Prob. 1.4ACh. 11.10 - Prob. 1.5ACh. 11.10 - Prob. 1.6ACh. 11.10 - Prob. 1.7ACh. 11.10 - Prob. 1.8ACh. 11.10 - Prob. 1.9ACh. 11.10 - Prob. 1.10ACh. 11 - Prob. 1GRCh. 11 - Prob. 2GRCh. 11 - Prob. 3GRCh. 11 - Prob. 4GRCh. 11 - Prob. 5GRCh. 11 - Prob. 6GRCh. 11 - Prob. 7GRCh. 11 - Prob. 8GRCh. 11 - Prob. 9GRCh. 11 - Prob. 10GRCh. 11 - Prob. 11GRCh. 11 - Prob. 12GRCh. 11 - Prob. 13GRCh. 11 - Prob. 14GRCh. 11 - Prob. 15GRCh. 11 - Prob. 16GRCh. 11 - Prob. 17GRCh. 11 - Prob. 18GRCh. 11 - Prob. 19GRCh. 11 - Prob. 20GRCh. 11 - Prob. 21GRCh. 11 - Prob. 22GRCh. 11 - Prob. 1MCQCh. 11 - Prob. 2MCQCh. 11 - Prob. 3MCQCh. 11 - Prob. 4MCQCh. 11 - Prob. 5MCQCh. 11 - Prob. 6MCQCh. 11 - Prob. 7MCQCh. 11 - Prob. 8MCQCh. 11 - Prob. 9MCQCh. 11 - Prob. 10MCQCh. 11 - Prob. 11MCQCh. 11 - Prob. 12MCQCh. 11 - Prob. 13MCQCh. 11 - Prob. 14MCQCh. 11 - Prob. 15MCQCh. 11 - Prob. 16MCQCh. 11 - Prob. 17MCQCh. 11 - Prob. 18MCQCh. 11 - Prob. 19MCQCh. 11 - Prob. 20MCQCh. 11 - Prob. 21MCQCh. 11 - Prob. 22MCQCh. 11 - Prob. 23MCQCh. 11 - Prob. 24MCQCh. 11 - Prob. 25MCQCh. 11 - Prob. 26MCQCh. 11 - Prob. 27MCQCh. 11 - Prob. 28MCQCh. 11 - Prob. 29MCQCh. 11 - Prob. 30MCQCh. 11 - Prob. 31MCQCh. 11 - Prob. 32MCQCh. 11 - Prob. 1CVCh. 11 - Prob. 2CVCh. 11 - Prob. 3CVCh. 11 - Prob. 4CVCh. 11 - Prob. 5ECh. 11 - Prob. 6ECh. 11 - Prob. 7ECh. 11 - Prob. 8ECh. 11 - Prob. 9ECh. 11 - Prob. 10ECh. 11 - Prob. 11ECh. 11 - Prob. 12ECh. 11 - Prob. 13ECh. 11 - Prob. 14ECh. 11 - Prob. 15ECh. 11 - Prob. 16ECh. 11 - Prob. 17ECh. 11 - Prob. 18ECh. 11 - Prob. 19ECh. 11 - Prob. 20ECh. 11 - Prob. 21ECh. 11 - Prob. 22ECh. 11 - Prob. 23ECh. 11 - Prob. 24ECh. 11 - Prob. 25ECh. 11 - Prob. 26ECh. 11 - Prob. 27ECh. 11 - Prob. 28ECh. 11 - Prob. 29ECh. 11 - Prob. 30ECh. 11 - Prob. 31ECh. 11 - Prob. 32ECh. 11 - Prob. 33ECh. 11 - Prob. 34ECh. 11 - Prob. 35ECh. 11 - Prob. 36ECh. 11 - Prob. 37ECh. 11 - Prob. 38ECh. 11 - Prob. 39ECh. 11 - Prob. 40ECh. 11 - Prob. 41ECh. 11 - Prob. 42ECh. 11 - Prob. 43ECh. 11 - Prob. 44ECh. 11 - Prob. 45ECh. 11 - Prob. 46ECh. 11 - Prob. 47ECh. 11 - Prob. 48ECh. 11 - Prob. 49ECh. 11 - Prob. 50ECh. 11 - Prob. 51ECh. 11 - Prob. 52ECh. 11 - Prob. 53ECh. 11 - Prob. 54ECh. 11 - Prob. 55ECh. 11 - Prob. 56ECh. 11 - Prob. 57ECh. 11 - Prob. 58ECh. 11 - Prob. 59ECh. 11 - Prob. 60ECh. 11 - Prob. 61ECh. 11 - Prob. 62ECh. 11 - Prob. 63ECh. 11 - Prob. 1CTCh. 11 - Prob. 2CTCh. 11 - Prob. 3CTCh. 11 - Prob. 4CTCh. 11 - Prob. 5CTCh. 11 - Prob. 6CTCh. 11 - Prob. 7CTCh. 11 - Prob. 8CTCh. 11 - Prob. 9CTCh. 11 - Prob. 10CTCh. 11 - Prob. 11CTCh. 11 - Prob. 12CTCh. 11 - Prob. 13CTCh. 11 - Prob. 14CTCh. 11 - Prob. 15CTCh. 11 - Prob. 16CTCh. 11 - Prob. 17CTCh. 11 - Prob. 18CTCh. 11 - Prob. 19CTCh. 11 - Prob. 20CTCh. 11 - Prob. 21CTCh. 11 - Prob. 22CTCh. 11 - Prob. 1CCSRCh. 11 - Prob. 2CCSRCh. 11 - Prob. 3CCSRCh. 11 - Prob. 4CCSRCh. 11 - Prob. 5CCSRCh. 11 - Prob. 6CCSRCh. 11 - Prob. 7CCSRCh. 11 - Prob. 8CCSRCh. 11 - Prob. 9CCSRCh. 11 - Prob. 10CCSRCh. 11 - Prob. 11CCSRCh. 11 - Prob. 12CCSRCh. 11 - Prob. 13CCSRCh. 11 - Prob. 14CCSRCh. 11 - Prob. 15CCSRCh. 11 - Prob. 16CCSRCh. 11 - Prob. 17CCSRCh. 11 - Prob. 18CCSRCh. 11 - Prob. 19CCSRCh. 11 - Prob. 20CCSRCh. 11 - Prob. 21CCSRCh. 11 - Prob. 22CCSRCh. 11 - Prob. 23CCSRCh. 11 - Prob. 24CCSRCh. 11 - Prob. 25CCSRCh. 11 - Prob. 26CCSRCh. 11 - Prob. 27CCSRCh. 11 - Prob. 28CCSRCh. 11 - Prob. 29CCSRCh. 11 - Prob. 30CCSRCh. 11 - Prob. 31CCSRCh. 11 - Prob. 32CCSR
Knowledge Booster

Recommended textbooks for you
 Algebra and Trigonometry (6th Edition)AlgebraISBN:9780134463216Author:Robert F. BlitzerPublisher:PEARSON
 Contemporary Abstract AlgebraAlgebraISBN:9781305657960Author:Joseph GallianPublisher:Cengage Learning
 Linear Algebra: A Modern IntroductionAlgebraISBN:9781285463247Author:David PoolePublisher:Cengage Learning
 Algebra And Trigonometry (11th Edition)AlgebraISBN:9780135163078Author:Michael SullivanPublisher:PEARSON
 Introduction to Linear Algebra, Fifth EditionAlgebraISBN:9780980232776Author:Gilbert StrangPublisher:Wellesley-Cambridge Press
 College Algebra (Collegiate Math)AlgebraISBN:9780077836344Author:Julie Miller, Donna GerkenPublisher:McGraw-Hill Education
Algebra and Trigonometry (6th Edition)
Algebra
ISBN:9780134463216
Author:Robert F. Blitzer
Publisher:PEARSON
Contemporary Abstract Algebra
Algebra
ISBN:9781305657960
Author:Joseph Gallian
Publisher:Cengage Learning
Linear Algebra: A Modern Introduction
Algebra
ISBN:9781285463247
Author:David Poole
Publisher:Cengage Learning
Algebra And Trigonometry (11th Edition)
Algebra
ISBN:9780135163078
Author:Michael Sullivan
Publisher:PEARSON
Introduction to Linear Algebra, Fifth Edition
Algebra
ISBN:9780980232776
Author:Gilbert Strang
Publisher:Wellesley-Cambridge Press
College Algebra (Collegiate Math)
Algebra
ISBN:9780077836344
Author:Julie Miller, Donna Gerken
Publisher:McGraw-Hill Education