
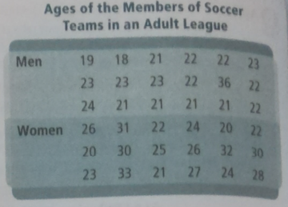
To find: a) The range, the mean, and the standard deviation of the ages for each team given.
b) For the two data sets, it is to be determined if the set with the greater range necessarily have the greater standard deviation.
a) The range, the mean, and the standard deviation for the given data set of Men are 18, 22.44 and 3.58 respectively.
The range, the mean, and the standard deviation for the given data set of Women are 13, 25.78 and 4.04 respectively.
b) The data with greater range need not necessarily have the greater standard deviation.
Given information:
Given data sets are:
Calculation:
The least age for Men is 18 and highest is 36.
Hence the range is
The mean of the data is given by:
To determine the variance, the following table is used:
| 19 | 22.44 | -3.44 | 11.83 |
| 18 | 22.44 | -4.44 | 19.71 |
| 21 | 22.44 | -1.44 | 2.07 |
| 22 | 22.44 | -0.44 | 0.19 |
| 22 | 22.44 | -0.44 | 0.19 |
| 23 | 22.44 | 0.56 | 0.31 |
| 23 | 22.44 | 0.56 | 0.31 |
| 23 | 22.44 | 0.56 | 0.31 |
| 23 | 22.44 | 0.56 | 0.31 |
| 22 | 22.44 | -0.44 | 0.19 |
| 36 | 22.44 | 13.56 | 183.87 |
| 22 | 22.44 | -0.44 | 0.19 |
| 24 | 22.44 | 1.56 | 2.43 |
| 21 | 22.44 | -1.44 | 2.07 |
| 21 | 22.44 | -1.44 | 2.07 |
| 21 | 22.44 | -1.44 | 2.07 |
| 21 | 22.44 | -1.44 | 2.07 |
| 22 | 22.44 | -0.44 | 0.19 |
| Sum | 230.38 |
Hence,
The standard deviation is given by:
The least age for Women is 20 and highest is 33.
Hence the range is
The mean of the data is given by:
To determine the variance, the following table is used:
| 26 | 25.78 | 0.22 | 0.05 |
| 31 | 25.78 | 5.22 | 27.25 |
| 22 | 25.78 | -3.78 | 14.29 |
| 24 | 25.78 | -1.78 | 3.17 |
| 20 | 25.78 | -5.78 | 33.41 |
| 22 | 25.78 | -3.78 | 14.29 |
| 20 | 25.78 | -5.78 | 33.41 |
| 30 | 25.78 | 4.22 | 17.81 |
| 25 | 25.78 | -0.78 | 0.61 |
| 26 | 25.78 | 0.22 | 0.05 |
| 32 | 25.78 | 6.22 | 38.69 |
| 30 | 25.78 | 4.22 | 17.81 |
| 23 | 25.78 | -2.78 | 7.73 |
| 33 | 25.78 | 7.22 | 52.13 |
| 21 | 25.78 | -4.78 | 22.85 |
| 27 | 25.78 | 1.22 | 1.49 |
| 24 | 25.78 | -1.78 | 3.17 |
| 28 | 25.78 | 2.22 | 4.93 |
| Sum | 293.14 |
Hence,
The standard deviation is given by:
b) The range of data for Men is 18 and the standard deviation is 3.58
The range of data for Women is 13 and the standard deviation is 4.04
Hence the data with greater range need not necessarily have the greater standard deviation.
Conclusion:
The range, the mean, and the standard deviation for the given data set of Men are 18, 22.44 and 3.58 respectively.
The range, the mean, and the standard deviation for the given data set of Women are 13, 25.78 and 4.04 respectively.
The data with greater range need not necessarily have the greater standard deviation.
Chapter 11 Solutions
High School Math 2015 Common Core Algebra 2 Student Edition Grades 10/11

 Algebra and Trigonometry (6th Edition)AlgebraISBN:9780134463216Author:Robert F. BlitzerPublisher:PEARSON
 Contemporary Abstract AlgebraAlgebraISBN:9781305657960Author:Joseph GallianPublisher:Cengage Learning
 Linear Algebra: A Modern IntroductionAlgebraISBN:9781285463247Author:David PoolePublisher:Cengage Learning
 Algebra And Trigonometry (11th Edition)AlgebraISBN:9780135163078Author:Michael SullivanPublisher:PEARSON
 Introduction to Linear Algebra, Fifth EditionAlgebraISBN:9780980232776Author:Gilbert StrangPublisher:Wellesley-Cambridge Press
 College Algebra (Collegiate Math)AlgebraISBN:9780077836344Author:Julie Miller, Donna GerkenPublisher:McGraw-Hill Education