
(a)
To compare: The graphs of the theoretical and experimental probabilities of sum on two dice and explain if the dice are fair.
Given:
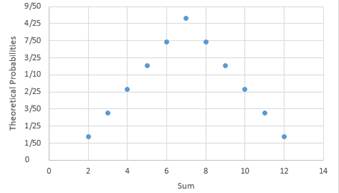
The graph of theoretical probability is shown below
The graph of experimental probability is shown below
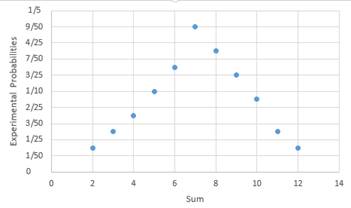
The graphs of theoretical probability and experimental probabilities are slightly different. The experimental probabilities are not equally likely but approximately close to theoretical probabilities. The overall sum of all probabilities is one. So it can be said that dice rolled to calculate experimental probabilities are considered to be fair.
(b)
To explain The differences in both theoretical and experimental probabilities.
Comparison:
The theoretical probabilities for a number on dice is always
Chapter 11 Solutions
High School Math 2015 Common Core Algebra 2 Student Edition Grades 10/11

 Algebra and Trigonometry (6th Edition)AlgebraISBN:9780134463216Author:Robert F. BlitzerPublisher:PEARSON
 Contemporary Abstract AlgebraAlgebraISBN:9781305657960Author:Joseph GallianPublisher:Cengage Learning
 Linear Algebra: A Modern IntroductionAlgebraISBN:9781285463247Author:David PoolePublisher:Cengage Learning
 Algebra And Trigonometry (11th Edition)AlgebraISBN:9780135163078Author:Michael SullivanPublisher:PEARSON
 Introduction to Linear Algebra, Fifth EditionAlgebraISBN:9780980232776Author:Gilbert StrangPublisher:Wellesley-Cambridge Press
 College Algebra (Collegiate Math)AlgebraISBN:9780077836344Author:Julie Miller, Donna GerkenPublisher:McGraw-Hill Education