
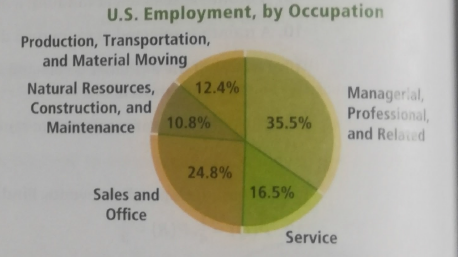
To identify:The probabilitya person is notinproduction transportation and material moving.The graph at the right shows the types of jobs held by people in the U.S.

The probabilityis
Given information:
Explanation:
Consider the information.
The objective is to find the probability that a person is not in production, transportation and material moving.
From the graph 12.4% population is in production, transportation and material moving
To find the probability that a person is not in production, transportation and material moving subtract the probability of the population is in production, transportation and material moving from 100 percent.
So probability that a person is not in production, transportation and material moving
Therefore.
Chapter 11 Solutions
High School Math 2015 Common Core Algebra 2 Student Edition Grades 10/11

 Algebra and Trigonometry (6th Edition)AlgebraISBN:9780134463216Author:Robert F. BlitzerPublisher:PEARSON
 Contemporary Abstract AlgebraAlgebraISBN:9781305657960Author:Joseph GallianPublisher:Cengage Learning
 Linear Algebra: A Modern IntroductionAlgebraISBN:9781285463247Author:David PoolePublisher:Cengage Learning
 Algebra And Trigonometry (11th Edition)AlgebraISBN:9780135163078Author:Michael SullivanPublisher:PEARSON
 Introduction to Linear Algebra, Fifth EditionAlgebraISBN:9780980232776Author:Gilbert StrangPublisher:Wellesley-Cambridge Press
 College Algebra (Collegiate Math)AlgebraISBN:9780077836344Author:Julie Miller, Donna GerkenPublisher:McGraw-Hill Education