
Statistics for Engineers and Scientists
4th Edition
ISBN: 9780073401331
Author: William Navidi Prof.
Publisher: McGraw-Hill Education
expand_more
expand_more
format_list_bulleted
Videos
Textbook Question
Chapter 8.1, Problem 1E
In an experiment to determine the factors affecting tensile strength in steel plates, the tensile strength (in kg/mm2), the manganese content (in parts per thousand), and the thickness (in mm) were measured for a sample of 20 plates. The following MINITAB output presents the results of fitting the model Tensile strength = β0 + β1 Manganese + β2 Thickness.
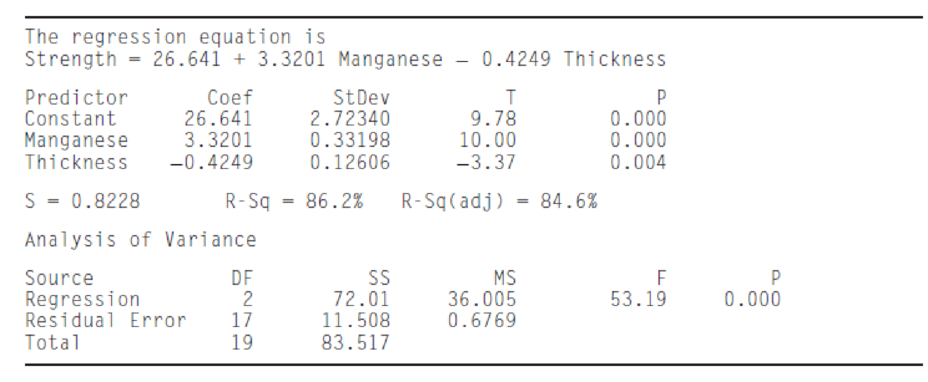
- a. Predict the strength for a specimen that is 10 mm thick and contains 8.2 ppt manganese.
- b. If two specimens have the same thickness, and one contains 10 ppt more manganese, by how much would you predict their strengths to differ?
- c. If two specimens have the same proportion of manganese, and one is 5 mm thicker than the other, by how much would you predict their strengths to differ?
Expert Solution & Answer
Want to see the full answer?
Check out a sample textbook solution
Students have asked these similar questions
Researchers interested in lead exposure due to car exhaust sampled the blood of 52 police officers subjected to constant inhalation of automobile exhaust fumes while working traffic enforcement in a primarily urban environment. The blood samples of these officers had an average lead concentration of 124.32 µg/l and a SD of 37.74 µg/l; a previous study of individuals from a nearby suburb, with no history of exposure, found an average blood level concentration of 35 µg/l.
Test the hypothesis that the downtown police officers have a higher lead exposure than the group in the previous study. Interpret your results in context.
Based on your preceding result, without performing a calculation, would a 99% confidence interval for the average blood concentration level of police officers contain 35 µg/l?
Based on your preceding result, without performing a calculation, would a 99% confidence interval for this difference contain 0? Explain why or why not.
The article “Withdrawal Strength of Threaded Nails” (D. Rammer, S. Winistorfer, and D. Bender, Journal of Structural Engineering 2001:442–449) describes an experiment comparing the ultimate withdrawal strengths (in N/mm) for several types of nails. For an annularly threaded nail with shank diameter 3.76 mm driven into spruce-pine-fir lumber, the ultimate withdrawal strength was modeled as lognormal with μ = 3.82 and σ = 0.219. For a helically threaded nail under the same conditions, the strength was modeled as lognormal with μ = 3.47 and σ = 0.272. a) What is the mean withdrawal strength for annularly threaded nails? b) What is the mean withdrawal strength for helically threaded nails? c) For which type of nail is it more probable that the withdrawal strength will be greater than 50 N/mm? d) What is the probability that a helically threaded nail will have a greater withdrawal strength than the median for annularly threaded nails? e) An experiment is performed in which withdrawal…
A deficiency of the trace element selenium in the diet can negatively impact growth, immunity, muscle and neuromuscular function, and fertility. The introduction of selenium supplements to dairy cows is justified when pastures have low selenium levels. Authors of the article “Effects of Short-Term Supplementation with Selenised Yeast on Milk Production and Composition of Lactating Cows” (Australian J. of Dairy Tech., 2004: 199–203) supplied the following data on milk selenium concentration (mg/L) for a sample of cows given a selenium supplement and a control sample given no supplement, both initially and after a 9-day period.
Obs
Init Se
Init Cont
Final Se
Final Cont
1
11.4
9.1
138.3
9.3
2
9.6
8.7
104
8.8
3
10.1
9.7
96.4
8.8
4
8.5
10.8
89
10.1
5
10.3
10.9
88
9.6
6
10.6
10.6
103.8
8.6
7
11.8
10.1
147.3
10.4
8
9.8
12.3
97.1
12.4
9
10.9
8.8
172.6
9.3
10
10.3…
Chapter 8 Solutions
Statistics for Engineers and Scientists
Ch. 8.1 - In an experiment to determine the factors...Ch. 8.1 - Prob. 2ECh. 8.1 - Prob. 3ECh. 8.1 - The article Application of Analysis of Variance to...Ch. 8.1 - Prob. 5ECh. 8.1 - Prob. 6ECh. 8.1 - Prob. 7ECh. 8.1 - Refer to Exercise 7. a. Find a 95% confidence...Ch. 8.1 - In a study of the lung function of children, the...Ch. 8.1 - Prob. 10E
Ch. 8.1 - Prob. 11ECh. 8.1 - The following MINITAB output is for a multiple...Ch. 8.1 - Prob. 13ECh. 8.1 - Prob. 14ECh. 8.1 - Prob. 15ECh. 8.1 - The following data were collected in an experiment...Ch. 8.1 - The November 24, 2001, issue of The Economist...Ch. 8.1 - The article Multiple Linear Regression for Lake...Ch. 8.1 - Prob. 19ECh. 8.2 - In an experiment to determine factors related to...Ch. 8.2 - In a laboratory test of a new engine design, the...Ch. 8.2 - In a laboratory test of a new engine design, the...Ch. 8.2 - The article Influence of Freezing Temperature on...Ch. 8.2 - The article Influence of Freezing Temperature on...Ch. 8.2 - The article Influence of Freezing Temperature on...Ch. 8.3 - True or false: a. For any set of data, there is...Ch. 8.3 - The article Experimental Design Approach for the...Ch. 8.3 - Prob. 3ECh. 8.3 - An engineer measures a dependent variable y and...Ch. 8.3 - Prob. 5ECh. 8.3 - The following MINITAB output is for a best subsets...Ch. 8.3 - Prob. 7ECh. 8.3 - Prob. 8ECh. 8.3 - (Continues Exercise 7 in Section 8.1.) To try to...Ch. 8.3 - Prob. 10ECh. 8.3 - Prob. 11ECh. 8.3 - Prob. 12ECh. 8.3 - The article Ultimate Load Analysis of Plate...Ch. 8.3 - Prob. 14ECh. 8.3 - Prob. 15ECh. 8.3 - Prob. 16ECh. 8.3 - The article Modeling Resilient Modulus and...Ch. 8.3 - The article Models for Assessing Hoisting Times of...Ch. 8 - The article Advances in Oxygen Equivalence...Ch. 8 - Prob. 2SECh. 8 - Prob. 3SECh. 8 - Prob. 4SECh. 8 - In a simulation of 30 mobile computer networks,...Ch. 8 - The data in Table SE6 (page 649) consist of yield...Ch. 8 - Prob. 7SECh. 8 - Prob. 8SECh. 8 - Refer to Exercise 2 in Section 8.2. a. Using each...Ch. 8 - Prob. 10SECh. 8 - The data presented in the following table give the...Ch. 8 - The article Enthalpies and Entropies of Transfer...Ch. 8 - Prob. 13SECh. 8 - Prob. 14SECh. 8 - The article Measurements of the Thermal...Ch. 8 - The article Electrical Impedance Variation with...Ch. 8 - The article Groundwater Electromagnetic Imaging in...Ch. 8 - Prob. 18SECh. 8 - Prob. 19SECh. 8 - Prob. 20SECh. 8 - Prob. 21SECh. 8 - Prob. 22SECh. 8 - The article Estimating Resource Requirements at...Ch. 8 - Prob. 24SE
Knowledge Booster


Learn more about
Need a deep-dive on the concept behind this application? Look no further. Learn more about this topic, statistics and related others by exploring similar questions and additional content below.Similar questions
- A manufacturer of paper used for making grocery bags is interested in improving the tensile strength of the product. Product engineering thinks that tensile strength is a function of the hard-wood concentration in the pulp and that the range of hardwood concentrations of practical interest is between 5 and 20%. A team of engineers responsible for the study decides to investigate four levels of hardwood concentration: 5%, 10%, 15%, and 20%. They decide to make up six test specimens at each concentration level, using a pilot plant. Using the data given below: a. Complete the ANOVA table. b. At 0.05 significance level, test whether there is a difference in mean tensile strength based on Hardwood Concentration.arrow_forwardResearchers interested in lead exposure due to car exhaust sampled the blood of 52 police officers subjected to constant inhalation of automobile exhaust fumes while working traffic enforcement in a primarily urban environment. The blood samples of these officers had an average lead concentration of 124.32 µg/l and an SD of 37.74 µg/l; a previous study of individuals from a nearby suburb, with no history of exposure, found an average blood level concentration of 35 µg/l. Write down the hypotheses that would be appropriate for testing if the police officers appear to have been exposed to a higher concentration of lead. Explicitly state and check all conditions necessary for inference on these data. Test the hypothesis that the downtown police officers have a higher lead exposure than the group in the previous study. Interpret your results in context. Based on your preceding result, without performing a calculation, would a 99% confidence interval for the average blood concentration…arrow_forwardThe article “Models for Assessing Hoisting Times of Tower Cranes” (A. Leung and C. Tam, Journal of Construction Engineering and Management, 1999: 385–391) presents a model constructed by a stepwise regression procedure to predict the time needed for a tower crane hoisting operation. Twenty variables were considered, and the stepwise procedure chose a nine-variable model. The adjusted R2 for the selected model was 0.73. True or false: a) The value 0.73 is a reliable measure of the goodness of fit of the selected model. b) The value 0.73 may exaggerate the goodness of fit of the model. c) A stepwise regression procedure selects only variables that are of some use in predicting the value of the dependent variable. d) It is possible for a variable that is of no use in predicting the value of a dependent variable to be part of a model selected by a stepwise regression procedure.arrow_forward
- At the 5% level of significance, which variables are statistically significant? If the price of cement per yard increases by 10, what will happen to the estimated quantity of cement demanded? What happens if it will increase by 20%?arrow_forwardA deficiency of the trace element selenium in the diet can negatively impact growth, immunity, muscle and neuromuscular function, and fertility. The introduction of selenium supplements to dairy cows is justified when pastures have low selenium levels. Authors of a research paper supplied the following data on milk selenium concentration (mg/L) for a sample of cows given a selenium supplement (the treatment group) and a control sample given no supplement, both initially and after a 9-day period. Initial Measurement Treatment Control 11.2 9.1 9.6 8.7 10.1 9.7 8.5 10.8 10.3 10.9 10.6 10.6 11.7 10.1 9.7 12.3 10.8 8.8 10.3 10.4 10.4 10.9 11.2 10.4 9.4 11.6 10.6 10.9 10.7 8.4 After 9 Days Treatment Control 138.3 9.3 104 8.7 96.4 8.7 89 10.1 88 9.6 103.8 8.6 147.3 10.2 97.1 12.2 172.6 9.3 146.3 9.5 99 8.2 122.3 8.9 103 12.5 117.8 9.1 121.5 93 (a) Use the given data for the treatment group to determine if there…arrow_forwardA deficiency of the trace element selenium in the diet can negatively impact growth, immunity, muscle and neuromuscular function, and fertility. The introduction of selenium supplements to dairy cows is justified when pastures have low selenium levels. Authors of a research paper supplied the following data on milk selenium concentration (mg/L) for a sample of cows given a selenium supplement (the treatment group) and a control sample given no supplement, both initially and after a 9-day period. Initial Measurement Treatment Control 11.3 9.1 9.7 8.7 10.1 9.7 8.5 10.8 10.4 10.9 10.7 10.6 11.8 10.1 9.8 12.3 10.6 8.8 10.4 10.4 10.2 10.9 11.3 10.4 9.2 11.6 10.7 10.9 10.8 8.2 After 9 Days Treatment Control 138.3 9.4 104 8.8 96.4 8.8 89 10.1 88 9.7 103.8 8.7 147.3 10.3 97.1 12.3 172.6 9.4 146.3 9.5 99 8.3 122.3 8.9 103 12.5 117.8 9.1 121.5 93 (a) Use the given data for the treatment group to determine if…arrow_forward
- A deficiency of the trace element selenium in the diet can negatively impact growth, immunity, muscle and neuromuscular function, and fertility. The introduction of selenium supplements to dairy cows is justified when pastures have low selenium levels. Authors of a research paper supplied the following data on milk selenium concentration (mg/L) for a sample of cows given a selenium supplement (the treatment group) and a control sample given no supplement, both initially and after a 9-day period. Initial Measurement Treatment Control 11.4 9.1 9.6 8.7 10.1 9.7 8.5 10.8 10.2 10.9 10.6 10.6 11.9 10.1 9.9 12.3 10.7 8.8 10.2 10.4 10.3 10.9 11.4 10.4 9.3 11.6 10.6 10.9 10.9 8.3 After 9 Days Treatment Control 138.3 9.2 104 8.9 96.4 8.9 89 10.1 88 9.6 103.8 8.6 147.3 10.4 97.1 12.4 172.6 9.2 146.3 9.5 99 8.4 122.3 8.8 103 12.5 117.8 9.1 121.5 93 (a) Use the given data for the treatment group to determine if…arrow_forwardA study was conducted to assess the impact of nutrient enrichment on zooplankton densities in A & B Islands. An ecologist sampled populations of zooplankton in these two locations and observed the nutrient enrichment level was higher in A island when compared with the level in B island. It is predicted the zooplankton densities in A island will be greater than those found in B island.arrow_forwardA consumer group is investigating a producer of diet meals to examine if its prepackaged meals actually contain the advertised 6 ounces of protein in each package. Based on the following data, is there any evidence that the meals do not contain the advertised amount of protein? Run the appropriate test at a 5% level ofarrow_forward
- In forestry, the diameter of a tree at breast height is used to model the height of the tree. Silviculturists working in British Columbia’s boreal forest conducted a series of spacing trials to predict the heights of several species of trees. The data are the breast height diameters (in centimeters) and heights (in meters) for a sample of 18 white spruce trees. B1 B2 18.9 20.0 15.5 16.8 19.4 20.2 20.0 20.0 29.8 20.2 19.8 18.0 20.3 17.8 20.0 19.2 22.0 22.3 16.6 18.8 15.5 16.9 13.7 16.3 27.5 21.4 20.3 19.2 22.9 19.8 14.1 18.5 10.1 12.1 5.8 8.0 B1: Breast Height Diameter of White spruce (cm) B2: Height (m) a) Plot the relationship using scatter diagram between the breast height diameters and the trees’ height. Are the breast height diameters and the trees’ height linearly related? What can you infer about the relationship between the two variables? Is a linear model appropriate? b) Compare the scatter plot in (a) with the correlation coefficient…arrow_forwardResearchers interested in lead exposure due to car exhaust sampled the blood of 52 police officers subjected to constant inhalation of automobile exhaust fumes while working traffic enforcement in a primarily urban environment. The blood samples of these officers had an average lead concentration of 124.32 µg/l and a SD of 37.74 µg/l; a previous study of individuals from a nearby suburb, with no history of exposure, found an average blood level concentration of 35 µg/l. Based on your preceding result, without performing a calculation, would a 99% confidence interval for the average blood concentration level of police officers contain 35 µg/l? Based on your preceding result, without performing a calculation, would a 99% confidence interval for this difference contain 0? Explain why or why not.arrow_forwardThe aging Neotropical termites (Neocapritermes taracua) secrete a sticky, blue-colored liquid that they spew to intruding termites. The younger Neotropical termites secrete a liquid that lacks the blue component, so it is white in appearance. In an experiment that measured the toxicity of the blue substance, the researchers placed one drop of either the blue liquid or the white liquid on individuals of a second termite species, Labiotermes labralis. Of the 41 Labiotermes labralis that got the blue drop, 37 were immobilized. Of the 40 Labiotermes labralis that got the white drop, 9 were immobilized. Is the blue liquid toxic compared to the white liquid?arrow_forward
arrow_back_ios
SEE MORE QUESTIONS
arrow_forward_ios
Recommended textbooks for you
 Glencoe Algebra 1, Student Edition, 9780079039897...AlgebraISBN:9780079039897Author:CarterPublisher:McGraw Hill
Glencoe Algebra 1, Student Edition, 9780079039897...
Algebra
ISBN:9780079039897
Author:Carter
Publisher:McGraw Hill
Hypothesis Testing using Confidence Interval Approach; Author: BUM2413 Applied Statistics UMP;https://www.youtube.com/watch?v=Hq1l3e9pLyY;License: Standard YouTube License, CC-BY
Hypothesis Testing - Difference of Two Means - Student's -Distribution & Normal Distribution; Author: The Organic Chemistry Tutor;https://www.youtube.com/watch?v=UcZwyzwWU7o;License: Standard Youtube License