Concepts of Genetics (12th Edition)
12th Edition
ISBN: 9780134604718
Author: William S. Klug, Michael R. Cummings, Charlotte A. Spencer, Michael A. Palladino, Darrell Killian
Publisher: PEARSON
expand_more
expand_more
format_list_bulleted
Concept explainers
Videos
Textbook Question
Chapter 6, Problem 18PDQ
In an analysis of rII mutants, complementation testing yielded the following results:
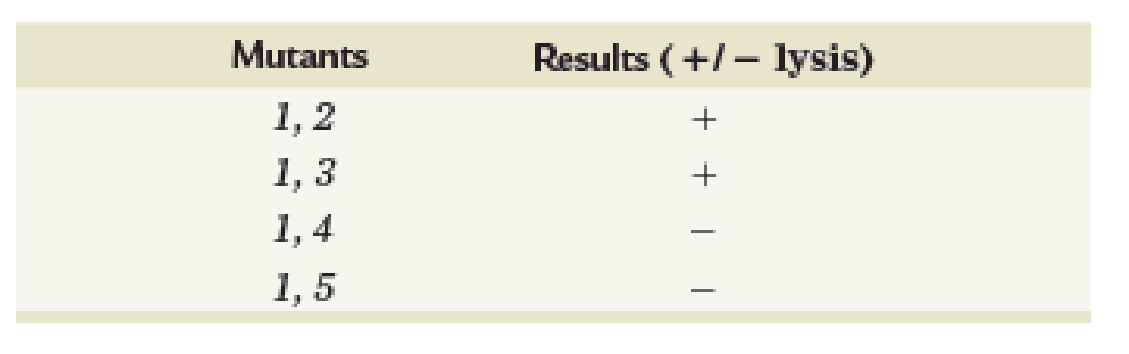
Predict the results of testing 2 and 3, 2 and 4, and 3 and 4 together.
Expert Solution & Answer
Want to see the full answer?
Check out a sample textbook solution
Students have asked these similar questions
What did the Cre-lox system used in the Kikuchi et al. 2010 heart regeneration experiment allow researchers to investigate?
What was the purpose of the cmlc2 promoter?
What is CreER and why was it used in this experiment?
If constitutively active Cre was driven by the cmlc2 promoter, rather than an inducible CreER system, what color would you expect new cardiomyocytes in the regenerated area to be no matter what? Why?
What kind of organ size regulation is occurring when you graft multiple organs into a mouse and the graft weight stays the same?
What is the concept "calories consumed must equal calories burned" in regrads to nutrition?
Chapter 6 Solutions
Concepts of Genetics (12th Edition)
Ch. 6 - When the interrupted mating technique was used...Ch. 6 - In a transformation experiment involving a...Ch. 6 - In complementation studies of the rII locus of...Ch. 6 - A 4-month-old infant had been running a moderate...Ch. 6 - Prob. 2CSCh. 6 - Prob. 3CSCh. 6 - Prob. 4CSCh. 6 - HOW DO WE KNOW? In this chapter, we have focused...Ch. 6 - Review the Chapter Concepts list on p. 123. Many...Ch. 6 - With respect to F+ and F bacterial matings, answer...
Ch. 6 - List all major differences between (a) the F+ F...Ch. 6 - Describe the basis for chromosome mapping in the...Ch. 6 - In general, when recombination experiments are...Ch. 6 - Why are the recombinants produced from an Hfr F...Ch. 6 - Describe the origin of F bacteria and merozygotes.Ch. 6 - In a transformation experiment, donor DNA was...Ch. 6 - Describe the role of heteroduplex formation during...Ch. 6 - Explain the observations that led Zinder and...Ch. 6 - Prob. 12PDQCh. 6 - Two theoretical genetic strains of a virus (abc...Ch. 6 - The bacteriophage genome consists of many genes...Ch. 6 - If a single bacteriophage infects one E. coli cell...Ch. 6 - A phage-infected bacterial culture was subjected...Ch. 6 - In recombination studies of the rII locus in phage...Ch. 6 - In an analysis of rII mutants, complementation...Ch. 6 - If further testing of the mutations in Problem 18...Ch. 6 - Using mutants 2 and 3 from Problem 19, following...Ch. 6 - During the analysis of seven rII mutations in...Ch. 6 - In studies of recombination between mutants 1 and...Ch. 6 - Prob. 23ESPCh. 6 - An Hfr strain is used to map three genes in an...Ch. 6 - A plaque assay is performed beginning with 1 mL of...Ch. 6 - In a cotransformation experiment, using various...Ch. 6 - For the experiment in Problem 26, another gene, g,...Ch. 6 - Bacterial conjugation, mediated mainly by...Ch. 6 - A study was conducted in an attempt to determine...
Knowledge Booster


Learn more about
Need a deep-dive on the concept behind this application? Look no further. Learn more about this topic, biology and related others by exploring similar questions and additional content below.Similar questions
- You intend to insert patched dominant negative DNA into the left half of the neural tube of a chick. 1) Which side of the neural tube would you put the positive electrode to ensure that the DNA ends up on the left side? 2) What would be the internal (within the embryo) control for this experiment? 3) How can you be sure that the electroporation method itself is not impacting the embryo? 4) What would you do to ensure that the electroporation is working? How can you tell?arrow_forwardDescribe a method to document the diffusion path and gradient of Sonic Hedgehog through the chicken embryo. If modifying the protein, what is one thing you have to consider in regards to maintaining the protein’s function?arrow_forwardThe following table is from Kumar et. al. Highly Selective Dopamine D3 Receptor (DR) Antagonists and Partial Agonists Based on Eticlopride and the D3R Crystal Structure: New Leads for Opioid Dependence Treatment. J. Med Chem 2016.arrow_forward
- The following figure is from Caterina et al. The capsaicin receptor: a heat activated ion channel in the pain pathway. Nature, 1997. Black boxes indicate capsaicin, white circles indicate resinferatoxin. You are a chef in a fancy new science-themed restaurant. You have a recipe that calls for 1 teaspoon of resinferatoxin, but you feel uncomfortable serving foods with "toxins" in them. How much capsaicin could you substitute instead?arrow_forwardWhat protein is necessary for packaging acetylcholine into synaptic vesicles?arrow_forward1. Match each vocabulary term to its best descriptor A. affinity B. efficacy C. inert D. mimic E. how drugs move through body F. how drugs bind Kd Bmax Agonist Antagonist Pharmacokinetics Pharmacodynamicsarrow_forward
- 50 mg dose of a drug is given orally to a patient. The bioavailability of the drug is 0.2. What is the volume of distribution of the drug if the plasma concentration is 1 mg/L? Be sure to provide units.arrow_forwardDetermine Kd and Bmax from the following Scatchard plot. Make sure to include units.arrow_forwardChoose a catecholamine neurotransmitter and describe/draw the components of the synapse important for its signaling including synthesis, packaging into vesicles, receptors, transporters/degradative enzymes. Describe 2 drugs that can act on this system.arrow_forward
- The following figure is from Caterina et al. The capsaicin receptor: a heat activated ion channel in the pain pathway. Nature, 1997. Black boxes indicate capsaicin, white circles indicate resinferatoxin. a) Which has a higher potency? b) Which is has a higher efficacy? c) What is the approximate Kd of capsaicin in uM? (you can round to the nearest power of 10)arrow_forwardWhat is the rate-limiting-step for serotonin synthesis?arrow_forwardWhat enzyme is necessary for synthesis of all of the monoamines?arrow_forward
arrow_back_ios
SEE MORE QUESTIONS
arrow_forward_ios
Recommended textbooks for you

 Biology: The Dynamic Science (MindTap Course List)BiologyISBN:9781305389892Author:Peter J. Russell, Paul E. Hertz, Beverly McMillanPublisher:Cengage Learning
- Case Studies In Health Information ManagementBiologyISBN:9781337676908Author:SCHNERINGPublisher:Cengage
 Human Heredity: Principles and Issues (MindTap Co...BiologyISBN:9781305251052Author:Michael CummingsPublisher:Cengage Learning
Biology: The Dynamic Science (MindTap Course List)
Biology
ISBN:9781305389892
Author:Peter J. Russell, Paul E. Hertz, Beverly McMillan
Publisher:Cengage Learning
Case Studies In Health Information Management
Biology
ISBN:9781337676908
Author:SCHNERING
Publisher:Cengage
Human Heredity: Principles and Issues (MindTap Co...
Biology
ISBN:9781305251052
Author:Michael Cummings
Publisher:Cengage Learning
Mitochondrial mutations; Author: Useful Genetics;https://www.youtube.com/watch?v=GvgXe-3RJeU;License: CC-BY