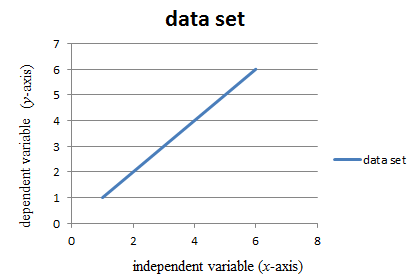
The type of variable that isplotted on the x-axis and on the y-axis.
Explanation of Solution
Introduction:
A graph is used to depict relationship between two variables at least. A basic graph has two axis, x-axis (horizontal axis) and y-axis (vertical axis).
There are two types of variables- Independent variable and dependent variable. The variable which changes due to the change in another variable is called dependent variable and the one due to which change occurs is called independent variable. An independent variable is represented on x-axis while a dependent variable is shown on y-axis. The relationship between these two determines the shape of the graph.

Figure: Basic form of a graph
Conclusion:
Hence, on the x-axis, an independent variable is representedwhilethe dependent variable is represented on the y-axis.
Chapter 1 Solutions
Glencoe Physical Science 2012 Student Edition (Glencoe Science) (McGraw-Hill Education)
Additional Science Textbook Solutions
University Physics (14th Edition)
Cosmic Perspective Fundamentals
Essential University Physics (3rd Edition)
Tutorials in Introductory Physics
Physics (5th Edition)
 College PhysicsPhysicsISBN:9781305952300Author:Raymond A. Serway, Chris VuillePublisher:Cengage Learning
 University Physics (14th Edition)PhysicsISBN:9780133969290Author:Hugh D. Young, Roger A. FreedmanPublisher:PEARSON
 Introduction To Quantum MechanicsPhysicsISBN:9781107189638Author:Griffiths, David J., Schroeter, Darrell F.Publisher:Cambridge University Press
 Physics for Scientists and EngineersPhysicsISBN:9781337553278Author:Raymond A. Serway, John W. JewettPublisher:Cengage Learning
 Lecture- Tutorials for Introductory AstronomyPhysicsISBN:9780321820464Author:Edward E. Prather, Tim P. Slater, Jeff P. Adams, Gina BrissendenPublisher:Addison-Wesley
 College Physics: A Strategic Approach (4th Editio...PhysicsISBN:9780134609034Author:Randall D. Knight (Professor Emeritus), Brian Jones, Stuart FieldPublisher:PEARSON


