
Introductory Statistics (10th Edition)
10th Edition
ISBN: 9780321989178
Author: Neil A. Weiss
Publisher: PEARSON
expand_more
expand_more
format_list_bulleted
Videos
Textbook Question
Chapter 8.3, Problem 132E
Preliminary data analyses indicate that you can reasonably apply the t-interval procedure (Procedure 8.2 on page 355) in Exercises 8.129–8.134.
8.132 Family Fun? Taking the family to an amusement park has become increasingly costly according to the industry publication Amusement Business, which provides figures on the cost for a family of four to spend the day at one of America’s amusement parks. A random sample of 25 families of four that attended amusement parks yielded the following costs, rounded to the nearest dollar.
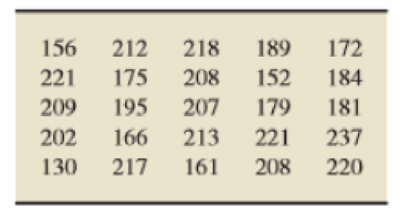
Obtain and interpret a 95% confidence interval for the
(Note: ˉx = $193.32; s = $26.73.)
Expert Solution & Answer
Want to see the full answer?
Check out a sample textbook solution
Students have asked these similar questions
Problem 3. Pricing a multi-stock option the Margrabe formula
The purpose of this problem is to price a swap option in a 2-stock model, similarly as
what we did in the example in the lectures. We consider a two-dimensional Brownian
motion given by W₁ = (W(¹), W(2)) on a probability space (Q, F,P). Two stock prices
are modeled by the following equations:
dX
=
dY₁ =
X₁ (rdt+
rdt+0₁dW!)
(²)),
Y₁ (rdt+dW+0zdW!"),
with Xo
xo and Yo =yo. This corresponds to the multi-stock model studied in class,
but with notation (X+, Y₁) instead of (S(1), S(2)). Given the model above, the measure
P is already the risk-neutral measure (Both stocks have rate of return r). We write
σ = 0₁+0%. We consider a swap option, which gives you the right, at time T, to
exchange one share of X for one share of Y. That is, the option has payoff
F=(Yr-XT).
(a) We first assume that r = 0 (for questions (a)-(f)). Write an explicit expression for
the process Xt.
Reminder before proceeding to question (b): Girsanov's theorem…
Problem 1. Multi-stock model
We consider a 2-stock model similar to the one studied in class. Namely, we consider
=
S(1)
S(2)
=
S(¹) exp (σ1B(1) + (M1 - 0/1 )
S(²) exp (02B(2) + (H₂-
M2
where (B(¹) ) +20 and (B(2) ) +≥o are two Brownian motions, with
t≥0
Cov (B(¹), B(2)) = p min{t, s}.
"
The purpose of this problem is to prove that there indeed exists a 2-dimensional Brownian
motion (W+)+20 (W(1), W(2))+20 such that
=
S(1)
S(2)
=
=
S(¹) exp (011W(¹) + (μ₁ - 01/1) t)
롱)
S(²) exp (021W (1) + 022W(2) + (112 - 03/01/12) t).
where σ11, 21, 22 are constants to be determined (as functions of σ1, σ2, p).
Hint: The constants will follow the formulas developed in the lectures.
(a) To show existence of (Ŵ+), first write the expression for both W. (¹) and W (2)
functions of (B(1), B(²)).
as
(b) Using the formulas obtained in (a), show that the process (WA) is actually a 2-
dimensional standard Brownian motion (i.e. show that each component is normal,
with mean 0, variance t, and that their…
The scores of 8 students on the midterm exam and final exam were as follows.
Student
Midterm
Final
Anderson
98
89
Bailey
88
74
Cruz
87
97
DeSana
85
79
Erickson
85
94
Francis
83
71
Gray
74
98
Harris
70
91
Find the value of the (Spearman's) rank correlation coefficient test statistic that would be used to test the claim of no correlation between midterm score and final exam score. Round your answer to 3 places after the decimal point, if necessary.
Test statistic: rs =
Chapter 8 Solutions
Introductory Statistics (10th Edition)
Ch. 8.1 - The value of a statistic used to estimate a...Ch. 8.1 - What is a confidence-interval estimate of a...Ch. 8.1 - Prob. 3ECh. 8.1 - Prob. 4ECh. 8.1 - Prob. 5ECh. 8.1 - Suppose that you lake 500 simple random samples...Ch. 8.1 - Prob. 7ECh. 8.1 - A simple random sample is taken from a population...Ch. 8.1 - Refer to Exercise 8.7 and find a point estimate...Ch. 8.1 - Prob. 10E
Ch. 8.1 - In each of Exercises 8.118.16, we provide a sample...Ch. 8.1 - Prob. 12ECh. 8.1 - In each of Exercises 8.118.16, we provide a sample...Ch. 8.1 - Prob. 14ECh. 8.1 - Prob. 15ECh. 8.1 - Prob. 16ECh. 8.1 - Wedding Costs. According to Brides Magazine,...Ch. 8.1 - Cottonmouth Litter Size. In the article The...Ch. 8.1 - Wedding Costs. Refer to Exercise 8.17. Assume that...Ch. 8.1 - Cottonmouth Litter Size. Refer to Exercise 8.18....Ch. 8.1 - Fuel Tank Capacity. Consumer Reports provides...Ch. 8.1 - Home Improvements. The American Express Retail...Ch. 8.1 - Giant Tarantulas. A tarantula has two body parts....Ch. 8.1 - Serum Cholesterol Levels. In formation on serum...Ch. 8.1 - Prob. 25ECh. 8.1 - New Mobile Homes. Refer to Examples 8.1 and 8.2....Ch. 8.2 - Find the confidence level and for a. a 90%...Ch. 8.2 - Find the confidence level and for a. an 85%...Ch. 8.2 - What is meant by saying that a 1 confidence...Ch. 8.2 - Prob. 30ECh. 8.2 - Prob. 31ECh. 8.2 - Refer to Procedure 8.1. a. Explain in detail the...Ch. 8.2 - Prob. 33ECh. 8.2 - Prob. 34ECh. 8.2 - Prob. 35ECh. 8.2 - In each of Exercises 8.348.39, assume that the...Ch. 8.2 - In each of Exercises 8.348.39, assume that the...Ch. 8.2 - In each of Exercises 8.348.39, assume that the...Ch. 8.2 - In each of Exercises 8.348.39, assume that the...Ch. 8.2 - Prob. 40ECh. 8.2 - Prob. 41ECh. 8.2 - Suppose that you will be taking a random sample...Ch. 8.2 - Prob. 43ECh. 8.2 - Prob. 44ECh. 8.2 - In each of Exercises 8.458.48, explain the effect...Ch. 8.2 - Prob. 46ECh. 8.2 - In each of Exercises 8.458.48, explain the effect...Ch. 8.2 - In each of Exercises 8.458.48, explain the effect...Ch. 8.2 - Prob. 49ECh. 8.2 - A confidence interval for a population mean has a...Ch. 8.2 - A confidence interval for a population mean has...Ch. 8.2 - Prob. 52ECh. 8.2 - Prob. 53ECh. 8.2 - In each of Exercises 8.538.60, answer true or...Ch. 8.2 - Prob. 55ECh. 8.2 - In each of Exercises 8.538.60, answer true or...Ch. 8.2 - Prob. 57ECh. 8.2 - In each of Exercises 8.538.60, answer true or...Ch. 8.2 - In each of Exercises 8.538.60, answer true or...Ch. 8.2 - In each of Exercises 8.538.60, answer true or...Ch. 8.2 - Formula 8.2 on page 344 provides a method for...Ch. 8.2 - Prob. 62ECh. 8.2 - Prob. 63ECh. 8.2 - In each of Exercises 8.638.68, we provide a sample...Ch. 8.2 - Prob. 65ECh. 8.2 - In each of Exercises 8.638.68, we provide a sample...Ch. 8.2 - In each of Exercises 8.638.68, we provide a sample...Ch. 8.2 - In each of Exercises 8.638.68, we provide a sample...Ch. 8.2 - Preliminary data analyses indicate that you can...Ch. 8.2 - Preliminary data analyses indicate that you can...Ch. 8.2 - Preliminary data analyses indicate that you can...Ch. 8.2 - Preliminary data analyses indicate that you can...Ch. 8.2 - Preliminary data analyses indicate that you can...Ch. 8.2 - Preliminary data analyses indicate that you can...Ch. 8.2 - Prob. 75ECh. 8.2 - Prob. 76ECh. 8.2 - Medical Marijuana. An issue with legalization of...Ch. 8.2 - Prob. 78ECh. 8.2 - Medical Marijuana. Refer to Exercise 8.77. a....Ch. 8.2 - American Alligators. Refer to Exercise 8.78. a....Ch. 8.2 - Medical Marijuana. Refer to Exercise 8.77. a. The...Ch. 8.2 - Prob. 82ECh. 8.2 - Prob. 83ECh. 8.2 - Prob. 84ECh. 8.2 - Pulmonary Hypertension. In the paper Persistent...Ch. 8.2 - Fuel Expenditures. In estimating the mean monthly...Ch. 8.2 - Prob. 87ECh. 8.2 - Prob. 88ECh. 8.2 - Political Prisoners. In Exercise 8.73, you found a...Ch. 8.2 - Keep on Rolling. In Exercise 8.74, you found a 99%...Ch. 8.2 - Prob. 91ECh. 8.2 - Prob. 92ECh. 8.2 - Doing Time. The U.S. Department of Justice, Office...Ch. 8.2 - Doing Time. The U.S. Department of Justice, Office...Ch. 8.2 - Prob. 95ECh. 8.2 - Prob. 96ECh. 8.2 - Prob. 97ECh. 8.2 - Corporate Farms. The U.S. Census Bureau estimates...Ch. 8.2 - Body Temperature. A study by researchers at the...Ch. 8.2 - Prob. 100ECh. 8.2 - Clocking the Cheetah. The cheetah (Acinonyx...Ch. 8.2 - Prob. 103ECh. 8.2 - Prob. 104ECh. 8.2 - Prob. 105ECh. 8.2 - Prob. 106ECh. 8.2 - Toxic Mushrooms? Refer to Exercise 8.71. a....Ch. 8.3 - Why do you need to consider the studentized...Ch. 8.3 - Prob. 109ECh. 8.3 - Prob. 110ECh. 8.3 - Prob. 111ECh. 8.3 - Batting Averages. An issue of Scientific American...Ch. 8.3 - Prob. 113ECh. 8.3 - Two t-curves have degrees of freedom 12 and 20,...Ch. 8.3 - For a t-curve with df = 6, use Table IV to find...Ch. 8.3 - For a t-curve with df = 17, use Table IV to find...Ch. 8.3 - Prob. 117ECh. 8.3 - Prob. 118ECh. 8.3 - Fuel Tank Capacity. Consumer Reports provides...Ch. 8.3 - Prob. 120ECh. 8.3 - Prob. 121ECh. 8.3 - Prob. 122ECh. 8.3 - In each of Exercises 8.1238.128, we provide a...Ch. 8.3 - In each of Exercises 8.1238.128, we provide a...Ch. 8.3 - In each of Exercises 8.1238.128, we provide a...Ch. 8.3 - Prob. 126ECh. 8.3 - Prob. 127ECh. 8.3 - In each of Exercises 8.1238.128, we provide a...Ch. 8.3 - Preliminary data analyses indicate that you can...Ch. 8.3 - Preliminary data analyses indicate that you can...Ch. 8.3 - Sleep. In 1908, W. S. Gosset published the article...Ch. 8.3 - Preliminary data analyses indicate that you can...Ch. 8.3 - Preliminary data analyses indicate that you can...Ch. 8.3 - Preliminary data analyses indicate that you can...Ch. 8.3 - In each of Exercises 8.135-8.138, use the...Ch. 8.3 - Prob. 136ECh. 8.3 - In each of Exercises 8.1358.138, use the...Ch. 8.3 - Prob. 138ECh. 8.3 - The Coruros Burrow. The subterranean coruro...Ch. 8.3 - Forearm Length. In 1903. K Pearson and A. Lee...Ch. 8.3 - Blood Cholesterol and Heart Disease. Numerous...Ch. 8.3 - Bicycle Commuting Times. A city planner working on...Ch. 8.3 - Prob. 143ECh. 8.3 - Prob. 144ECh. 8.3 - Prob. 146ECh. 8.3 - Another type of confidence interval is called a...Ch. 8.3 - Another type of confidence interval is called a...Ch. 8.3 - Prob. 149ECh. 8.3 - Christmas Spending. In a national poll of 1039...Ch. 8 - Explain the difference between a point estimate of...Ch. 8 - Answer true or false to the following statement,...Ch. 8 - Must the variable under consideration be normally...Ch. 8 - Prob. 4RPCh. 8 - Prob. 5RPCh. 8 - Suppose that you intend to find a 95% confidence...Ch. 8 - A confidence interval for a population mean has a...Ch. 8 - Suppose that you plan to apply the one-mean...Ch. 8 - A variable of a population has a mean of 266 and a...Ch. 8 - Baby Weight. The paper Are Babies Normal? by T....Ch. 8 - The following figure shows the standard normal...Ch. 8 - In each of Problems 1217, we have provided a...Ch. 8 - In each of Problems 1217, we have provided a...Ch. 8 - In each of Problems 1217, we have provided a...Ch. 8 - In each of Problems 1217, we have provided a...Ch. 8 - In each of Problems 1217, we have provided a...Ch. 8 - In each of Problems 1217, we have provided a...Ch. 8 - For a t-curve with df = 18, obtain the t-value and...Ch. 8 - Millionaires. Dr. Thomas Stanley of Georgia Slate...Ch. 8 - Millionaires. From Problem 19, we know that a 95%...Ch. 8 - Prison Sentences. Researchers M. Dhami et al....Ch. 8 - Prison Sentences. Refer to Problem 21. a. Find the...Ch. 8 - Children of Diabetic Mothers. The paper...Ch. 8 - Diamond Pricing. In a Singapore edition of...Ch. 8 - Wildfires. Wildfires are uncontrolled fires that...Ch. 8 - Fuel Economy. The U.S. Department of Energy...Ch. 8 - Prob. 28RPCh. 8 - UWEC UNDERGRADUATES Recall from Chapter 1 (see...Ch. 8 - BANK ROBBERIES: A STATISTICAL ANALYSIS At the...
Knowledge Booster


Learn more about
Need a deep-dive on the concept behind this application? Look no further. Learn more about this topic, statistics and related others by exploring similar questions and additional content below.Similar questions
- Business discussarrow_forwardBusiness discussarrow_forwardI just need to know why this is wrong below: What is the test statistic W? W=5 (incorrect) and What is the p-value of this test? (p-value < 0.001-- incorrect) Use the Wilcoxon signed rank test to test the hypothesis that the median number of pages in the statistics books in the library from which the sample was taken is 400. A sample of 12 statistics books have the following numbers of pages pages 127 217 486 132 397 297 396 327 292 256 358 272 What is the sum of the negative ranks (W-)? 75 What is the sum of the positive ranks (W+)? 5What type of test is this? two tailedWhat is the test statistic W? 5 These are the critical values for a 1-tailed Wilcoxon Signed Rank test for n=12 Alpha Level 0.001 0.005 0.01 0.025 0.05 0.1 0.2 Critical Value 75 70 68 64 60 56 50 What is the p-value for this test? p-value < 0.001arrow_forward
- ons 12. A sociologist hypothesizes that the crime rate is higher in areas with higher poverty rate and lower median income. She col- lects data on the crime rate (crimes per 100,000 residents), the poverty rate (in %), and the median income (in $1,000s) from 41 New England cities. A portion of the regression results is shown in the following table. Standard Coefficients error t stat p-value Intercept -301.62 549.71 -0.55 0.5864 Poverty 53.16 14.22 3.74 0.0006 Income 4.95 8.26 0.60 0.5526 a. b. Are the signs as expected on the slope coefficients? Predict the crime rate in an area with a poverty rate of 20% and a median income of $50,000. 3. Using data from 50 workarrow_forward2. The owner of several used-car dealerships believes that the selling price of a used car can best be predicted using the car's age. He uses data on the recent selling price (in $) and age of 20 used sedans to estimate Price = Po + B₁Age + ε. A portion of the regression results is shown in the accompanying table. Standard Coefficients Intercept 21187.94 Error 733.42 t Stat p-value 28.89 1.56E-16 Age -1208.25 128.95 -9.37 2.41E-08 a. What is the estimate for B₁? Interpret this value. b. What is the sample regression equation? C. Predict the selling price of a 5-year-old sedan.arrow_forwardian income of $50,000. erty rate of 13. Using data from 50 workers, a researcher estimates Wage = Bo+B,Education + B₂Experience + B3Age+e, where Wage is the hourly wage rate and Education, Experience, and Age are the years of higher education, the years of experience, and the age of the worker, respectively. A portion of the regression results is shown in the following table. ni ogolloo bash 1 Standard Coefficients error t stat p-value Intercept 7.87 4.09 1.93 0.0603 Education 1.44 0.34 4.24 0.0001 Experience 0.45 0.14 3.16 0.0028 Age -0.01 0.08 -0.14 0.8920 a. Interpret the estimated coefficients for Education and Experience. b. Predict the hourly wage rate for a 30-year-old worker with four years of higher education and three years of experience.arrow_forward
- 1. If a firm spends more on advertising, is it likely to increase sales? Data on annual sales (in $100,000s) and advertising expenditures (in $10,000s) were collected for 20 firms in order to estimate the model Sales = Po + B₁Advertising + ε. A portion of the regression results is shown in the accompanying table. Intercept Advertising Standard Coefficients Error t Stat p-value -7.42 1.46 -5.09 7.66E-05 0.42 0.05 8.70 7.26E-08 a. Interpret the estimated slope coefficient. b. What is the sample regression equation? C. Predict the sales for a firm that spends $500,000 annually on advertising.arrow_forwardCan you help me solve problem 38 with steps im stuck.arrow_forwardHow do the samples hold up to the efficiency test? What percentages of the samples pass or fail the test? What would be the likelihood of having the following specific number of efficiency test failures in the next 300 processors tested? 1 failures, 5 failures, 10 failures and 20 failures.arrow_forward
- The battery temperatures are a major concern for us. Can you analyze and describe the sample data? What are the average and median temperatures? How much variability is there in the temperatures? Is there anything that stands out? Our engineers’ assumption is that the temperature data is normally distributed. If that is the case, what would be the likelihood that the Safety Zone temperature will exceed 5.15 degrees? What is the probability that the Safety Zone temperature will be less than 4.65 degrees? What is the actual percentage of samples that exceed 5.25 degrees or are less than 4.75 degrees? Is the manufacturing process producing units with stable Safety Zone temperatures? Can you check if there are any apparent changes in the temperature pattern? Are there any outliers? A closer look at the Z-scores should help you in this regard.arrow_forwardNeed help pleasearrow_forwardPlease conduct a step by step of these statistical tests on separate sheets of Microsoft Excel. If the calculations in Microsoft Excel are incorrect, the null and alternative hypotheses, as well as the conclusions drawn from them, will be meaningless and will not receive any points. 4. One-Way ANOVA: Analyze the customer satisfaction scores across four different product categories to determine if there is a significant difference in means. (Hints: The null can be about maintaining status-quo or no difference among groups) H0 = H1=arrow_forward
arrow_back_ios
SEE MORE QUESTIONS
arrow_forward_ios
Recommended textbooks for you
 Glencoe Algebra 1, Student Edition, 9780079039897...AlgebraISBN:9780079039897Author:CarterPublisher:McGraw Hill
 Big Ideas Math A Bridge To Success Algebra 1: Stu...AlgebraISBN:9781680331141Author:HOUGHTON MIFFLIN HARCOURTPublisher:Houghton Mifflin Harcourt
 Holt Mcdougal Larson Pre-algebra: Student Edition...AlgebraISBN:9780547587776Author:HOLT MCDOUGALPublisher:HOLT MCDOUGAL
Glencoe Algebra 1, Student Edition, 9780079039897...
Algebra
ISBN:9780079039897
Author:Carter
Publisher:McGraw Hill
Big Ideas Math A Bridge To Success Algebra 1: Stu...
Algebra
ISBN:9781680331141
Author:HOUGHTON MIFFLIN HARCOURT
Publisher:Houghton Mifflin Harcourt
Holt Mcdougal Larson Pre-algebra: Student Edition...
Algebra
ISBN:9780547587776
Author:HOLT MCDOUGAL
Publisher:HOLT MCDOUGAL
Chi Square test; Author: Vectors Academy;https://www.youtube.com/watch?v=f53nXHoMXx4;License: Standard YouTube License, CC-BY