
Videos
Preliminary data analyses indicate that you can reasonably apply the z-interval procedure (Procedure 8.1 on page 339) in Exercises 8.69–8.74.
8.69 Venture-Capital Investments. Data on investments in the high-tech industry by venture capitalists are compiled by VentureOneCorporation and published in America’s Network Telecom Investor Supplement. A random sample of 18 venture-capital investments in the fiber optics business sector yielded the following data, in millions of dollars.
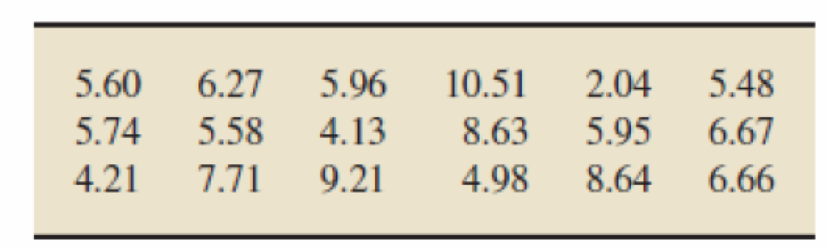
Determine and interpret a 95% confidence interval for the
Want to see the full answer?
Check out a sample textbook solution
Chapter 8 Solutions
Introductory Statistics (10th Edition)


- A survey of recent e-commerce start-up firms was undertaken at an industry convention. Representatives of the firm were asked for the geographic location of the firm as well as the firm's outlook for growth in the coming year. The results are provided below. Region 2nd 1st 3rd 4th 0.19 Exp. Growth Low 0.04 0.12 0.14 Medium 0.05 0.08 0.06 0.12 High 0.03 0.05 0.08 0.04 Are the events "firm from the 2nd region" and "expects high growth" statistically independent? O a. Unable to tell from the data O b. No O c. Yes O d. Maybearrow_forwardA particular magazine identified the top accounting firms in 8 geographic regions across a certain country. Even though all 8 regions reported growth in the past year, region A and region B reported the highest combined growths, with 17% and 25%, respectively. A characteristic description of the accounting firms in these regions included the number of partners in the firm. The accompanying table contains data on the number of partners. Complete parts (a) through (d) below. E Click on the icon to view the data table. IMPORTANT NOTE: In all of these questions, there are 2 possible ratios A/B and B/AI Our convention is to always assume that the larger variance is in the numerator (i.e., on top). The correct answer will always be found in this fashion. Similarly, in questions about a critical value, we shall consider the right (upper) tail. a. At the 0.01 level of significance, is there evidence of a difference in the variability in numbers of partners for region A accounting firms and…arrow_forwardYou decide to invest in stock in a particular type of company and set the guideline that you will only buy stock in companies that are ranked in the 80th percentile or above in terms of dividends paid in the previous year. You are looking at a company that ranked 7 out of 450 companies that paid dividends in 2019. a.Will this company qualifies for your portfolio? b.If you had the data on the total dividends paid by each of the 450 companies, which measure of average would be the most meaningful – mean, median, midrange, or mode? Explainarrow_forward
- Entrepreneur magazine ranks franchises using performance measures such as growth rate, number of locations, startup costs, and financial stability. The number of locations for the top 20 U.S. franchises follow (The World Almanac). No. U.S. Locations Franchise Franchise Hampton Inn No. U.S. Locations 1,825 4,152 Jan-Pro Franchising Intl. Inc. 14,621 ampm Hardee's 1,870 McDonald's 31,628 Pizza Hut Inc. 15,735 7-Eleven Inc. 37,341 Kumon Math & Reading Centers 26,609 Supercuts 2,249 Dunkin' Donuts 9,446 Days Inn 1,902 KFC Corp. 16,517 Jazzercise Inc. 7,504 Vanguard Cleaning Systems Servpro 2,290 1,526 33,899 Anytime Fitness 1,802 Matco Tools 1,731 Subway Denny's Inc. 1,744 Stratus Building Solutions 5,541 Use classes 0 - 4,999, 5,000-9,999, 10,000 14,999, and so forth to answer the following questions. a. Construct a frequency distribution and a percent frequency distribution of the number of U.S. locations for these top-ranked franchises. If your answer is "zero", enter "0". Round your…arrow_forwardExercise 6.3.2 and Exercise 6.3.3arrow_forwardIs it possible to predict the annual number of business bankruptcies by the number of firm births (business starts) in the United States? The following data published by the U.S. Small Business Administration, Office of Advocacy, are pairs of the number of business bankruptcies (1,000s) and the number of firm births (10,000s) for a six-year period. Business Bankruptcies (1,000) 34.3 Firm Births (10,000) 58.1 35.0 55.4 38.5 57.0 40.1 58.5 35.5 57.4 37.9 58.0 i) Based on the output given, use these data to develop the equation of the regression model to predict the number of business bankruptcies by the number of firm births. ii) Explain the values of r and r. iii) Predict the number of business bankruptcies if the number of firm births is 54.0 (10,000s). iv) Do the data support the existence of a linear relationship between the number of firm births and the number of business bankruptcies? Test using a = 0.05. OUTPUT Model Summary Std. Error of the Estimate Adusted R Model R R Square…arrow_forward
- A survey of 137 investment managers in a poll revealed the following. • 46% of managers classified themselves as bullish or very bullish on the stock market. • The average expected returm over the next 12 months for egquities was 11.5%. - 21% selected health care as the sector most likely to lead the market in the next 12 months. • When asked to estimate how long it would take for technology and telecom stocks to resume sustainable growth, the managers' average response was 2.8 years (a) Cite two descriptive statistics. (Select all that apply.) O of those investment managers surveyed, 46% were bulish or very bullish on the stock market. O of those investment managers surveyed, 21% selected health care as the sector most likely to lead the market in the next 12 months. D of those investment managers surveyed, 46% were bulish or very bullish on health care stocks over the next 2.8 years. D of those linvestment managers surveyed, 11.5% expect it would take 12 months for equities to resume…arrow_forward2.8 Poverty and language. The American Community Survey is an ongoing survey that provides data every year to give communities the current information they need to plan investments and services. The 2010 American Community Survey estimates that 14.6% of Americans live below the poverty line, 20.7% speak a language other than English (foreign language) at home, and 4.2% fall into both categories.59 (a) Are living below the poverty line and speaking a foreign language at home disjoint? (b) Draw a Venn diagram summarizing the variables and their associated probabilities. (c) What percent of Americans live below the poverty line and only speak English at home? (d) What percent of Americans live below the poverty line or speak a foreign language at home? (e) What percent of Americans live above the poverty line and only speak English at home? (f) Is the event that someone lives below the poverty line independent of the event that the person speaks a foreign language at home?arrow_forwardThe article "Credit Card Activity for College Students"† estimated that in 2013, 62% of undergraduates with credit cards pay them off each month and that the average outstanding balance on undergraduates' credit cards is $650. These estimates were based on an online survey of 800 college students. What additional information would you want in order to decide if it is reasonable to generalize the reported estimates to the population of all undergraduate students? (Select all that apply.)arrow_forward
- Premium control has a three machine process; the reliability ratings for the machines in the process are 0.7, 0.8, and 0.9. Each machine in the process is backed up by a redundant machine which has a reliability of 0.9. The increase in system reliability due to the redundancy is -----%?arrow_forwardThe model predicts the percentage of people trusting in government' will be ___% in 2025?arrow_forwardThe price per share of stock for a sample of 25 companies was recorded at the beginning of the first financial quarter and then again at the end of the first financial quarter. How stocks perform during the first financial quarter is an indicator of what is ahead for the stock market and the economy.Company End of 1st quarter Beginning of 1st quarterBank of New York Mellon 54.19 53.82Kraft Foods 55.70 77.02E.I. du Pont de Nemours and Company 102.57 109.00Consolidated Edison 79.95 83.58Johnson & Johnson 126.01 139.23Union Pacific 132.73…arrow_forward
 Big Ideas Math A Bridge To Success Algebra 1: Stu...AlgebraISBN:9781680331141Author:HOUGHTON MIFFLIN HARCOURTPublisher:Houghton Mifflin Harcourt