
Videos
Preliminary data analyses indicate that you can reasonably apply the z-interval procedure (Procedure 8.1 on page 339) in Exercises 8.69–8.74.
8.72 Smelling Out the Enemy. Snakes deposit chemical trails as they travel through their habitats. These trails are often detected and recognized by lizards, which are potential prey. The ability to recognize their predators via tongue flicks can often
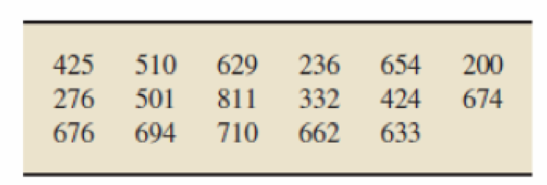
Find and interpret a 90% confidence interval for the mean number of tongue flicks per 20 minutes for all juvenile common lizards. Assume a population standard deviation of 190.0.
Want to see the full answer?
Check out a sample textbook solution
Chapter 8 Solutions
Introductory Statistics (10th Edition)


- A prospective cohort study is run to estimate the incidence of stroke in persons 55 years of age and older. All participants are free of stroke at study start. Each participant is followed for a maximum of 5 years. The data are summarized in Table 3–14. Number of Strokes Number of Stroke-Free Person-Years Men (n = 125) 9 478 Women (n = 200) 21 97 What is the annual incidence rate of stroke in men? What is the annual incidence rate of stroke in women? What is the annual incidence rate of stroke (men and women combined)?arrow_forwardThe table below shows the estimated vaccination coverage of adolescents aged 13-17 years, as reported in national surveys in 2020 and 2021. Vaccine Percent vaccinated (95% CI) Tdap (tetanus, diphtheria, and acellular pertussis vaccine) 2020: 90.1 (89.2–90.9) 2021: 89.6 (88.6–90.5) MMR (measles, mumps, and rubella vaccine) 2020: 92.4 (91.6–93.2) 2021: 92.2 (91.2–93.2) HPV (human papillomavirus vaccine) 2020: 58.6 (57.3–60.0) 2021: 61.7 (60.2–63.2) Answer these: a. For which vaccine(s) was there a statistically significant change in coverage from 2020 to 2021? For each, note whether it was a statistically significant increase or decrease? b. For which vaccine(s) was there no significant change in coverage from 2020 to 2021?arrow_forwardCellulon, a manufacturer of home insulation, wants to develop guidelines for builders and consumers on how the thickness of the insulation in the attic of a home and the outdoor temperature affect natural gas consumption. In the laboratory, it varied the insulation thickness and temperature. A few of the findings are:arrow_forward
- Special dyes have been developed that only bind to DNA. The intensity of the color is directly related to the quantity of DNA present in the cell. A haploid cell would have a “low” amount of color, a cell in G1 would have a “medium” amount of color, and a cell in M phase would have a “high” amount of color. Is this sort of assessment quantitative, qualitative or semi-quantitative? Justify your reasoning.arrow_forwardWhich model—the one for parliaments or the one for ministries (or cabinets)—presented in the article has the greater explanatory power? How can you tell?arrow_forwardYou may need to use the appropriate technology to answer this question. An automobile dealer conducted a test to determine if the time in minutes needed to complete a minor engine tune-up depends on whether a computerized engine analyzer or an electronic analyzer is used. Because tune-up time varies among compact, intermediate, and full-sized cars, the three types of cars were used as blocks in the experiment. The data obtained follow. Analyzer computerized electronic Car compact 50 41 Intermediate 56 45 Full Sized 62 46 Use ? = 0.05 to test for any significant differences. State the null and alternative hypotheses. H0: ?Computerized = ?ElectronicHa: ?Computerized ≠ ?ElectronicH0: ?Computerized ≠ ?ElectronicHa: ?Computerized = ?Electronic H0: ?Computerized = ?Electronic = ?Compact = ?Intermediate = ?Full-sizedHa: Not all the population means are equal.H0: ?Compact = ?Intermediate = ?Full-sizedHa: ?Compact ≠ ?Intermediate ≠ ?Full-sizedH0:…arrow_forward
- You may need to use the appropriate technology to answer this question. An automobile dealer conducted a test to determine if the time in minutes needed to complete a minor engine tune-up depends on whether a computerized engine analyzer or an electronic analyzer is used. Because tune-up time varies among compact, intermediate, and full-sized cars, the three types of cars were us blocks in the experiment. The data obtained follow. Analyzer Computerized Electronic Compact 50 41 Car Intermediate 54 44 Full-sized 64 47 Use a = 0.05 to test for any significant differences. State the null and alternative hypotheses. O Ho: MCompact = "Intermediate = "Full-sized H: "Compact *"Intermediate * Full-sized O Ho: "Compact * "Intermediate * Full-sized H: "Compact = "Intermediate "Full-sized O Ho: "Computerized = HElectronic H: "Computerized * "Electronic O Ho: "Computerized = "Electronic = "Compact = 4Intermediate = "Full-sized H: Not all the population means are equal. O Ho: "Computerized *…arrow_forwardYou may need to use the appropriate technology to answer this question. An automobile dealer conducted a test to determine if the time in minutes needed to complete a minor engine tune-up depends on whether a computerized engine analyzer or an electronic analyzer is used. Because tune-up time varies among compact, intermediate, and full-sized cars, the three types of cars were used as blocks in the experiment. The data obtained follow. Analyzer Computerized Electronic Compact 50 41 Car Intermediate 54 44 Full-sized 64 47 Use a = 0.05 to test for any significant differences. State the null and alternative hypotheses. O Ho: MCompact = "Intermediate = HFull-sized H: "Compact * "Intermediate * "Full-sized O Ho: "Compact * "Intermediate * HFull-sized H: "Compact "Intermediate = "Full-sized O Ho: Computerized = HElectronic H: "Computerized * HElectronic O Ho: "Computerized = HElectronic = "Compact = Intermediate = Full-sized H: Not all the population means are equal. O Ho: HComputerized *…arrow_forwardPart 4 of 4 Summarize the results. There (Choose one) enough evidence to conclude that the second-graders in the superintendent's school district have h the nationwide average. differe is is notarrow_forward
- Can you give a scenario for e and f please?arrow_forwardA relationship expert wants to know if people with higher levels of emotionalintelligence (measured on an interval scale from 1–6, with higher numbers meaning more intelligence) will be better liked upon first meeting people (measured on a 1–5 interval scale, with higher numbers meaning more likable). X: Emotional Intelligence Score Y: First Impression Rating 6 4.5 3 3.2 2.5 3 1 2 M=3.13s=2.10SS = 13.19 M=3.18s=1.03SS = 3.17 a) Create a scatterplot of the data.b) Calculate r and r2 .c) Report results in APA style.d) What do the results mean?arrow_forwardA relationship expert wants to know if people with higher levels of emotionalintelligence (measured on an interval scale from 1–6, with higher numbers meaning more intelligence) will be better liked upon first meeting people (measured on a 1–5 interval scale, with higher numbers meaning more likable). X: Emotional Intelligence Score Y: First Impression Rating 6 4.5 2.5 3.2 3 3 1 2 M=3.13s=2.10SS = 13.19 M=3.18s=1.03SS = 3.17 c) Report results in APA style.d) What do the results mean?arrow_forward
 MATLAB: An Introduction with ApplicationsStatisticsISBN:9781119256830Author:Amos GilatPublisher:John Wiley & Sons Inc
 Probability and Statistics for Engineering and th...StatisticsISBN:9781305251809Author:Jay L. DevorePublisher:Cengage Learning
 Statistics for The Behavioral Sciences (MindTap C...StatisticsISBN:9781305504912Author:Frederick J Gravetter, Larry B. WallnauPublisher:Cengage Learning
 Elementary Statistics: Picturing the World (7th E...StatisticsISBN:9780134683416Author:Ron Larson, Betsy FarberPublisher:PEARSON
 The Basic Practice of StatisticsStatisticsISBN:9781319042578Author:David S. Moore, William I. Notz, Michael A. FlignerPublisher:W. H. Freeman
 Introduction to the Practice of StatisticsStatisticsISBN:9781319013387Author:David S. Moore, George P. McCabe, Bruce A. CraigPublisher:W. H. Freeman