
Introductory Statistics (10th Edition)
10th Edition
ISBN: 9780321989178
Author: Neil A. Weiss
Publisher: PEARSON
expand_more
expand_more
format_list_bulleted
Videos
Textbook Question
Chapter 8.1, Problem 22E
Home Improvements. The American Express Retail Index provides information on budget amounts for home improvements. The following table displays the budgets, in dollars, of 45 randomly sampled home improvement jobs in the United States.
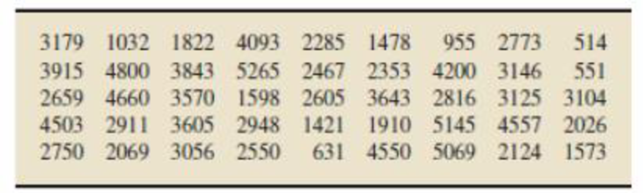
- a. Determine a point estimate for the population
mean budget, μ, for such home improvement jobs. Interpret your answer in words. (Note: The sum of the data is $129,849.) - b. Obtain a 95% confidence interval for the population mean budget, μ, for such home improvement jobs and interpret your result in words. Assume that the population standard deviation of budgets for home improvement jobs is $1350.
- c. How would you decide whether budgets for such home improvement jobs are approximately
normally distributed ? - d. Must the budgets for such home improvement jobs be exactly normally distributed for the confidence interval that you obtained in part (b) to be approximately correct? Explain your answer.
Expert Solution & Answer
Want to see the full answer?
Check out a sample textbook solution
Students have asked these similar questions
K
The mean height of women in a country (ages 20-29) is 63.7 inches. A random sample of 65 women in this age group
is selected. What is the probability that the mean height for the sample is greater than 64 inches? Assume σ = 2.68.
The probability that the mean height for the sample is greater than 64 inches is
(Round to four decimal places as needed.)
In a survey of a group of men, the heights in the 20-29 age group were normally distributed, with a mean of 69.6 inches
and a standard deviation of 4.0 inches. A study participant is randomly selected. Complete parts (a) through (d) below.
(a) Find the probability that a study participant has a height that is less than 68 inches.
The probability that the study participant selected at random is less than 68 inches tall is 0.4. (Round to four decimal
places as needed.)
20
2
PEER REPLY 1:
Choose a classmate's Main Post and review their decision making process.
1. Choose a risk level for each of the states of nature (assign a probability
value to each).
2. Explain why each risk level is chosen.
3. Which alternative do you believe would be the best based on the maximum
EMV?
4. Do you feel determining the expected value with perfect information
(EVWPI) is worthwhile in this situation? Why or why not?
Chapter 8 Solutions
Introductory Statistics (10th Edition)
Ch. 8.1 - The value of a statistic used to estimate a...Ch. 8.1 - What is a confidence-interval estimate of a...Ch. 8.1 - Prob. 3ECh. 8.1 - Prob. 4ECh. 8.1 - Prob. 5ECh. 8.1 - Suppose that you lake 500 simple random samples...Ch. 8.1 - Prob. 7ECh. 8.1 - A simple random sample is taken from a population...Ch. 8.1 - Refer to Exercise 8.7 and find a point estimate...Ch. 8.1 - Prob. 10E
Ch. 8.1 - In each of Exercises 8.118.16, we provide a sample...Ch. 8.1 - Prob. 12ECh. 8.1 - In each of Exercises 8.118.16, we provide a sample...Ch. 8.1 - Prob. 14ECh. 8.1 - Prob. 15ECh. 8.1 - Prob. 16ECh. 8.1 - Wedding Costs. According to Brides Magazine,...Ch. 8.1 - Cottonmouth Litter Size. In the article The...Ch. 8.1 - Wedding Costs. Refer to Exercise 8.17. Assume that...Ch. 8.1 - Cottonmouth Litter Size. Refer to Exercise 8.18....Ch. 8.1 - Fuel Tank Capacity. Consumer Reports provides...Ch. 8.1 - Home Improvements. The American Express Retail...Ch. 8.1 - Giant Tarantulas. A tarantula has two body parts....Ch. 8.1 - Serum Cholesterol Levels. In formation on serum...Ch. 8.1 - Prob. 25ECh. 8.1 - New Mobile Homes. Refer to Examples 8.1 and 8.2....Ch. 8.2 - Find the confidence level and for a. a 90%...Ch. 8.2 - Find the confidence level and for a. an 85%...Ch. 8.2 - What is meant by saying that a 1 confidence...Ch. 8.2 - Prob. 30ECh. 8.2 - Prob. 31ECh. 8.2 - Refer to Procedure 8.1. a. Explain in detail the...Ch. 8.2 - Prob. 33ECh. 8.2 - Prob. 34ECh. 8.2 - Prob. 35ECh. 8.2 - In each of Exercises 8.348.39, assume that the...Ch. 8.2 - In each of Exercises 8.348.39, assume that the...Ch. 8.2 - In each of Exercises 8.348.39, assume that the...Ch. 8.2 - In each of Exercises 8.348.39, assume that the...Ch. 8.2 - Prob. 40ECh. 8.2 - Prob. 41ECh. 8.2 - Suppose that you will be taking a random sample...Ch. 8.2 - Prob. 43ECh. 8.2 - Prob. 44ECh. 8.2 - In each of Exercises 8.458.48, explain the effect...Ch. 8.2 - Prob. 46ECh. 8.2 - In each of Exercises 8.458.48, explain the effect...Ch. 8.2 - In each of Exercises 8.458.48, explain the effect...Ch. 8.2 - Prob. 49ECh. 8.2 - A confidence interval for a population mean has a...Ch. 8.2 - A confidence interval for a population mean has...Ch. 8.2 - Prob. 52ECh. 8.2 - Prob. 53ECh. 8.2 - In each of Exercises 8.538.60, answer true or...Ch. 8.2 - Prob. 55ECh. 8.2 - In each of Exercises 8.538.60, answer true or...Ch. 8.2 - Prob. 57ECh. 8.2 - In each of Exercises 8.538.60, answer true or...Ch. 8.2 - In each of Exercises 8.538.60, answer true or...Ch. 8.2 - In each of Exercises 8.538.60, answer true or...Ch. 8.2 - Formula 8.2 on page 344 provides a method for...Ch. 8.2 - Prob. 62ECh. 8.2 - Prob. 63ECh. 8.2 - In each of Exercises 8.638.68, we provide a sample...Ch. 8.2 - Prob. 65ECh. 8.2 - In each of Exercises 8.638.68, we provide a sample...Ch. 8.2 - In each of Exercises 8.638.68, we provide a sample...Ch. 8.2 - In each of Exercises 8.638.68, we provide a sample...Ch. 8.2 - Preliminary data analyses indicate that you can...Ch. 8.2 - Preliminary data analyses indicate that you can...Ch. 8.2 - Preliminary data analyses indicate that you can...Ch. 8.2 - Preliminary data analyses indicate that you can...Ch. 8.2 - Preliminary data analyses indicate that you can...Ch. 8.2 - Preliminary data analyses indicate that you can...Ch. 8.2 - Prob. 75ECh. 8.2 - Prob. 76ECh. 8.2 - Medical Marijuana. An issue with legalization of...Ch. 8.2 - Prob. 78ECh. 8.2 - Medical Marijuana. Refer to Exercise 8.77. a....Ch. 8.2 - American Alligators. Refer to Exercise 8.78. a....Ch. 8.2 - Medical Marijuana. Refer to Exercise 8.77. a. The...Ch. 8.2 - Prob. 82ECh. 8.2 - Prob. 83ECh. 8.2 - Prob. 84ECh. 8.2 - Pulmonary Hypertension. In the paper Persistent...Ch. 8.2 - Fuel Expenditures. In estimating the mean monthly...Ch. 8.2 - Prob. 87ECh. 8.2 - Prob. 88ECh. 8.2 - Political Prisoners. In Exercise 8.73, you found a...Ch. 8.2 - Keep on Rolling. In Exercise 8.74, you found a 99%...Ch. 8.2 - Prob. 91ECh. 8.2 - Prob. 92ECh. 8.2 - Doing Time. The U.S. Department of Justice, Office...Ch. 8.2 - Doing Time. The U.S. Department of Justice, Office...Ch. 8.2 - Prob. 95ECh. 8.2 - Prob. 96ECh. 8.2 - Prob. 97ECh. 8.2 - Corporate Farms. The U.S. Census Bureau estimates...Ch. 8.2 - Body Temperature. A study by researchers at the...Ch. 8.2 - Prob. 100ECh. 8.2 - Clocking the Cheetah. The cheetah (Acinonyx...Ch. 8.2 - Prob. 103ECh. 8.2 - Prob. 104ECh. 8.2 - Prob. 105ECh. 8.2 - Prob. 106ECh. 8.2 - Toxic Mushrooms? Refer to Exercise 8.71. a....Ch. 8.3 - Why do you need to consider the studentized...Ch. 8.3 - Prob. 109ECh. 8.3 - Prob. 110ECh. 8.3 - Prob. 111ECh. 8.3 - Batting Averages. An issue of Scientific American...Ch. 8.3 - Prob. 113ECh. 8.3 - Two t-curves have degrees of freedom 12 and 20,...Ch. 8.3 - For a t-curve with df = 6, use Table IV to find...Ch. 8.3 - For a t-curve with df = 17, use Table IV to find...Ch. 8.3 - Prob. 117ECh. 8.3 - Prob. 118ECh. 8.3 - Fuel Tank Capacity. Consumer Reports provides...Ch. 8.3 - Prob. 120ECh. 8.3 - Prob. 121ECh. 8.3 - Prob. 122ECh. 8.3 - In each of Exercises 8.1238.128, we provide a...Ch. 8.3 - In each of Exercises 8.1238.128, we provide a...Ch. 8.3 - In each of Exercises 8.1238.128, we provide a...Ch. 8.3 - Prob. 126ECh. 8.3 - Prob. 127ECh. 8.3 - In each of Exercises 8.1238.128, we provide a...Ch. 8.3 - Preliminary data analyses indicate that you can...Ch. 8.3 - Preliminary data analyses indicate that you can...Ch. 8.3 - Sleep. In 1908, W. S. Gosset published the article...Ch. 8.3 - Preliminary data analyses indicate that you can...Ch. 8.3 - Preliminary data analyses indicate that you can...Ch. 8.3 - Preliminary data analyses indicate that you can...Ch. 8.3 - In each of Exercises 8.135-8.138, use the...Ch. 8.3 - Prob. 136ECh. 8.3 - In each of Exercises 8.1358.138, use the...Ch. 8.3 - Prob. 138ECh. 8.3 - The Coruros Burrow. The subterranean coruro...Ch. 8.3 - Forearm Length. In 1903. K Pearson and A. Lee...Ch. 8.3 - Blood Cholesterol and Heart Disease. Numerous...Ch. 8.3 - Bicycle Commuting Times. A city planner working on...Ch. 8.3 - Prob. 143ECh. 8.3 - Prob. 144ECh. 8.3 - Prob. 146ECh. 8.3 - Another type of confidence interval is called a...Ch. 8.3 - Another type of confidence interval is called a...Ch. 8.3 - Prob. 149ECh. 8.3 - Christmas Spending. In a national poll of 1039...Ch. 8 - Explain the difference between a point estimate of...Ch. 8 - Answer true or false to the following statement,...Ch. 8 - Must the variable under consideration be normally...Ch. 8 - Prob. 4RPCh. 8 - Prob. 5RPCh. 8 - Suppose that you intend to find a 95% confidence...Ch. 8 - A confidence interval for a population mean has a...Ch. 8 - Suppose that you plan to apply the one-mean...Ch. 8 - A variable of a population has a mean of 266 and a...Ch. 8 - Baby Weight. The paper Are Babies Normal? by T....Ch. 8 - The following figure shows the standard normal...Ch. 8 - In each of Problems 1217, we have provided a...Ch. 8 - In each of Problems 1217, we have provided a...Ch. 8 - In each of Problems 1217, we have provided a...Ch. 8 - In each of Problems 1217, we have provided a...Ch. 8 - In each of Problems 1217, we have provided a...Ch. 8 - In each of Problems 1217, we have provided a...Ch. 8 - For a t-curve with df = 18, obtain the t-value and...Ch. 8 - Millionaires. Dr. Thomas Stanley of Georgia Slate...Ch. 8 - Millionaires. From Problem 19, we know that a 95%...Ch. 8 - Prison Sentences. Researchers M. Dhami et al....Ch. 8 - Prison Sentences. Refer to Problem 21. a. Find the...Ch. 8 - Children of Diabetic Mothers. The paper...Ch. 8 - Diamond Pricing. In a Singapore edition of...Ch. 8 - Wildfires. Wildfires are uncontrolled fires that...Ch. 8 - Fuel Economy. The U.S. Department of Energy...Ch. 8 - Prob. 28RPCh. 8 - UWEC UNDERGRADUATES Recall from Chapter 1 (see...Ch. 8 - BANK ROBBERIES: A STATISTICAL ANALYSIS At the...
Knowledge Booster


Learn more about
Need a deep-dive on the concept behind this application? Look no further. Learn more about this topic, statistics and related others by exploring similar questions and additional content below.Similar questions
- Questions An insurance company's cumulative incurred claims for the last 5 accident years are given in the following table: Development Year Accident Year 0 2018 1 2 3 4 245 267 274 289 292 2019 255 276 288 294 2020 265 283 292 2021 263 278 2022 271 It can be assumed that claims are fully run off after 4 years. The premiums received for each year are: Accident Year Premium 2018 306 2019 312 2020 318 2021 326 2022 330 You do not need to make any allowance for inflation. 1. (a) Calculate the reserve at the end of 2022 using the basic chain ladder method. (b) Calculate the reserve at the end of 2022 using the Bornhuetter-Ferguson method. 2. Comment on the differences in the reserves produced by the methods in Part 1.arrow_forwardYou are provided with data that includes all 50 states of the United States. Your task is to draw a sample of: o 20 States using Random Sampling (2 points: 1 for random number generation; 1 for random sample) o 10 States using Systematic Sampling (4 points: 1 for random numbers generation; 1 for random sample different from the previous answer; 1 for correct K value calculation table; 1 for correct sample drawn by using systematic sampling) (For systematic sampling, do not use the original data directly. Instead, first randomize the data, and then use the randomized dataset to draw your sample. Furthermore, do not use the random list previously generated, instead, generate a new random sample for this part. For more details, please see the snapshot provided at the end.) Upload a Microsoft Excel file with two separate sheets. One sheet provides random sampling while the other provides systematic sampling. Excel snapshots that can help you in organizing columns are provided on the next…arrow_forwardThe population mean and standard deviation are given below. Find the required probability and determine whether the given sample mean would be considered unusual. For a sample of n = 65, find the probability of a sample mean being greater than 225 if μ = 224 and σ = 3.5. For a sample of n = 65, the probability of a sample mean being greater than 225 if μ=224 and σ = 3.5 is 0.0102 (Round to four decimal places as needed.)arrow_forward
- ***Please do not just simply copy and paste the other solution for this problem posted on bartleby as that solution does not have all of the parts completed for this problem. Please answer this I will leave a like on the problem. The data needed to answer this question is given in the following link (file is on view only so if you would like to make a copy to make it easier for yourself feel free to do so) https://docs.google.com/spreadsheets/d/1aV5rsxdNjHnkeTkm5VqHzBXZgW-Ptbs3vqwk0SYiQPo/edit?usp=sharingarrow_forwardThe data needed to answer this question is given in the following link (file is on view only so if you would like to make a copy to make it easier for yourself feel free to do so) https://docs.google.com/spreadsheets/d/1aV5rsxdNjHnkeTkm5VqHzBXZgW-Ptbs3vqwk0SYiQPo/edit?usp=sharingarrow_forwardThe following relates to Problems 4 and 5. Christchurch, New Zealand experienced a major earthquake on February 22, 2011. It destroyed 100,000 homes. Data were collected on a sample of 300 damaged homes. These data are saved in the file called CIEG315 Homework 4 data.xlsx, which is available on Canvas under Files. A subset of the data is shown in the accompanying table. Two of the variables are qualitative in nature: Wall construction and roof construction. Two of the variables are quantitative: (1) Peak ground acceleration (PGA), a measure of the intensity of ground shaking that the home experienced in the earthquake (in units of acceleration of gravity, g); (2) Damage, which indicates the amount of damage experienced in the earthquake in New Zealand dollars; and (3) Building value, the pre-earthquake value of the home in New Zealand dollars. PGA (g) Damage (NZ$) Building Value (NZ$) Wall Construction Roof Construction Property ID 1 0.645 2 0.101 141,416 2,826 253,000 B 305,000 B T 3…arrow_forward
- Rose Par posted Apr 5, 2025 9:01 PM Subscribe To: Store Owner From: Rose Par, Manager Subject: Decision About Selling Custom Flower Bouquets Date: April 5, 2025 Our shop, which prides itself on selling handmade gifts and cultural items, has recently received inquiries from customers about the availability of fresh flower bouquets for special occasions. This has prompted me to consider whether we should introduce custom flower bouquets in our shop. We need to decide whether to start offering this new product. There are three options: provide a complete selection of custom bouquets for events like birthdays and anniversaries, start small with just a few ready-made flower arrangements, or do not add flowers. There are also three possible outcomes. First, we might see high demand, and the bouquets could sell quickly. Second, we might have medium demand, with a few sold each week. Third, there might be low demand, and the flowers may not sell well, possibly going to waste. These outcomes…arrow_forwardConsider the state space model X₁ = §Xt−1 + Wt, Yt = AX+Vt, where Xt Є R4 and Y E R². Suppose we know the covariance matrices for Wt and Vt. How many unknown parameters are there in the model?arrow_forwardBusiness Discussarrow_forward
- You want to obtain a sample to estimate the proportion of a population that possess a particular genetic marker. Based on previous evidence, you believe approximately p∗=11% of the population have the genetic marker. You would like to be 90% confident that your estimate is within 0.5% of the true population proportion. How large of a sample size is required?n = (Wrong: 10,603) Do not round mid-calculation. However, you may use a critical value accurate to three decimal places.arrow_forward2. [20] Let {X1,..., Xn} be a random sample from Ber(p), where p = (0, 1). Consider two estimators of the parameter p: 1 p=X_and_p= n+2 (x+1). For each of p and p, find the bias and MSE.arrow_forward1. [20] The joint PDF of RVs X and Y is given by xe-(z+y), r>0, y > 0, fx,y(x, y) = 0, otherwise. (a) Find P(0X≤1, 1arrow_forward
arrow_back_ios
SEE MORE QUESTIONS
arrow_forward_ios
Recommended textbooks for you
 Glencoe Algebra 1, Student Edition, 9780079039897...AlgebraISBN:9780079039897Author:CarterPublisher:McGraw Hill
 Big Ideas Math A Bridge To Success Algebra 1: Stu...AlgebraISBN:9781680331141Author:HOUGHTON MIFFLIN HARCOURTPublisher:Houghton Mifflin Harcourt
Glencoe Algebra 1, Student Edition, 9780079039897...
Algebra
ISBN:9780079039897
Author:Carter
Publisher:McGraw Hill
Big Ideas Math A Bridge To Success Algebra 1: Stu...
Algebra
ISBN:9781680331141
Author:HOUGHTON MIFFLIN HARCOURT
Publisher:Houghton Mifflin Harcourt
Hypothesis Testing using Confidence Interval Approach; Author: BUM2413 Applied Statistics UMP;https://www.youtube.com/watch?v=Hq1l3e9pLyY;License: Standard YouTube License, CC-BY
Hypothesis Testing - Difference of Two Means - Student's -Distribution & Normal Distribution; Author: The Organic Chemistry Tutor;https://www.youtube.com/watch?v=UcZwyzwWU7o;License: Standard Youtube License