
Concept explainers
Videos
To show:
The numbers of entrees in certain price ranges at two different restaurants.
Explanation of Solution
Given:
Each entry in a two −way table
Concept used:
Bivariate joint frequency distribution are
The total row and total column of the marginal distribution while the body of the table is the joint frequencies
Calculation:
Draw the graph
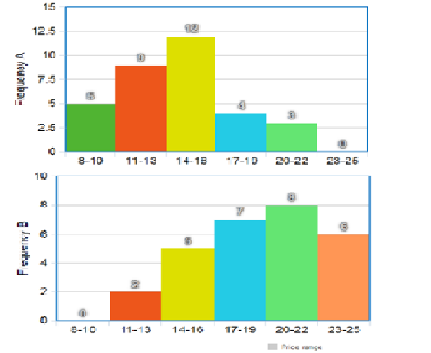
For restaurant A:- The data on the right of the distribution is approximately a mirror image of the data on the left of the distribution then the distribution is symmetric
So,the mean and standard deviation best represent the distribution for restaurant A.
The mean is probably at the
For restaurant B:- The data are on the right and and the tail of the graph extends to the left the distribution is skewed left, the distribution is skewed left.
Therefore,use the median to the center and the five-number summary to the variation.
The median is probably at the
Chapter 7 Solutions
BIG IDEAS MATH Integrated Math 1: Student Edition 2016


 Discrete Mathematics and Its Applications ( 8th I...MathISBN:9781259676512Author:Kenneth H RosenPublisher:McGraw-Hill Education
 Mathematics for Elementary Teachers with Activiti...MathISBN:9780134392790Author:Beckmann, SybillaPublisher:PEARSON
 Thinking Mathematically (7th Edition)MathISBN:9780134683713Author:Robert F. BlitzerPublisher:PEARSON
 Discrete Mathematics With ApplicationsMathISBN:9781337694193Author:EPP, Susanna S.Publisher:Cengage Learning,
 Pathways To Math Literacy (looseleaf)MathISBN:9781259985607Author:David Sobecki Professor, Brian A. MercerPublisher:McGraw-Hill Education