
Concept explainers
Videos
The comparison between the given distributions using their shapes and measures of center and variation.
Explanation of Solution
Given:
The given distributions are:
Calculation:
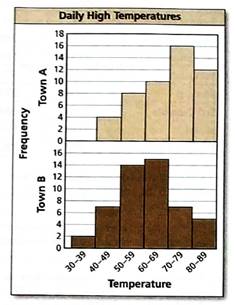
Looking at the histogram for Town A, the tail of the given graph extends to the left and most of the data is on the right, hence the distribution is skewed left. Therefore, median and five-number summary will best describe the center and variation for town A.
Looking at the histogram for Town B, the data at the right of the distribution is approximately a mirror image of the data present at the left, hence the distribution is symmetric. Therefore, mean and standard deviation will best describe the center and variation for town B.
Town B will have the mean in 70-79 interval and the median of Town A will lie in 50-59 interval.
Therefore, Town A will have greater daily high temperatures.
And the daily high temperatures differ more in Town B.
Chapter 7 Solutions
BIG IDEAS MATH Integrated Math 1: Student Edition 2016


 Discrete Mathematics and Its Applications ( 8th I...MathISBN:9781259676512Author:Kenneth H RosenPublisher:McGraw-Hill Education
 Mathematics for Elementary Teachers with Activiti...MathISBN:9780134392790Author:Beckmann, SybillaPublisher:PEARSON
 Thinking Mathematically (7th Edition)MathISBN:9780134683713Author:Robert F. BlitzerPublisher:PEARSON
 Discrete Mathematics With ApplicationsMathISBN:9781337694193Author:EPP, Susanna S.Publisher:Cengage Learning,
 Pathways To Math Literacy (looseleaf)MathISBN:9781259985607Author:David Sobecki Professor, Brian A. MercerPublisher:McGraw-Hill Education