
Concept explainers
Videos
(a)
To Find: The display of the in the histogram and then describe the shape of the distribution.
(a)
Answer to Problem 11CR
The histogram is shown in Figure 1 majority of the data is on the left and the tail of the graph extends to the right this shows that the distribution is skewed to the right.
Given:
The given diagram is shown in Table 1
Table 1
| Amount | Frequency |
| 0-0.99 | 9 |
| 1-1.9 | 10 |
| 2-2.99 | 9 |
| 3-3.99 | 7 |
| 4-4.99 | 4 |
| 5-5.99 | 1 |
Calculation:
From the data shown in table1 the bar graph for the data shown is shown in Figure 1
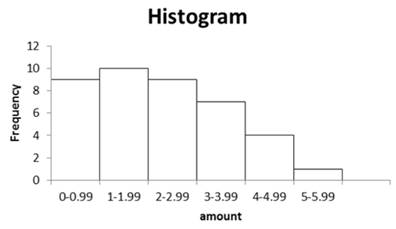
Figure 2
The majority of the data is on the left and the tail of the graph extends to the right this shows that the distribution is skewed to the right.
(b)
To Find: The measure for the centre and the variation that best represent the data.
The median is used to determine the centre and use the five number summary to determine the variation.
The distribution of the figure 1 shows that it is skewed and the median is used to determine the centre and use the five number summary to determine the variation.
(c)
To Find: The comparison of the distribution with the distribution given and use the shapes and the appropriate measure of the centre and variation.
The adults typically have more money in the pockets and amount may vary.
Given:
The given diagram is shown in Figure 2
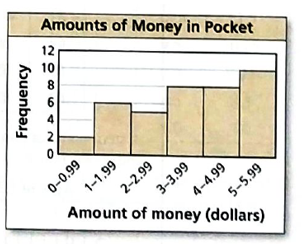
Figure 2
Calculation:
The distribution is skewed to the right and the majority of the data is on the left, since the tail of the graph extends to the right this shows that the median is used to determine the centre and use the five number summary to determine the variation.
Thus, the adults typically have more money in the pockets and amount may vary.
Explanation of Solution
Given:
The given diagram is shown in Table 1
Table 1
| Amount | Frequency |
| 0-0.99 | 9 |
| 1-1.9 | 10 |
| 2-2.99 | 9 |
| 3-3.99 | 7 |
| 4-4.99 | 4 |
| 5-5.99 | 1 |
Calculation:
From the data shown in table1 the bar graph for the data shown is shown in Figure 1
Figure 2
The majority of the data is on the left and the tail of the graph extends to the right this shows that the distribution is skewed to the right.
(b)
To Find: The measure for the centre and the variation that best represent the data.
(b)
Answer to Problem 11CR
The median is used to determine the centre and use the five number summary to determine the variation.
The distribution of the figure 1 shows that it is skewed and the median is used to determine the centre and use the five number summary to determine the variation.
(c)
To Find: The comparison of the distribution with the distribution given and use the shapes and the appropriate measure of the centre and variation.
The adults typically have more money in the pockets and amount may vary.
Given:
The given diagram is shown in Figure 2
Figure 2
Calculation:
The distribution is skewed to the right and the majority of the data is on the left, since the tail of the graph extends to the right this shows that the median is used to determine the centre and use the five number summary to determine the variation.
Thus, the adults typically have more money in the pockets and amount may vary.
Explanation of Solution
The distribution of the figure 1 shows that it is skewed and the median is used to determine the centre and use the five number summary to determine the variation.
(c)
To Find: The comparison of the distribution with the distribution given and use the shapes and the appropriate measure of the centre and variation.
(c)
Answer to Problem 11CR
The adults typically have more money in the pockets and amount may vary.
Given:
The given diagram is shown in Figure 2
Figure 2
Calculation:
The distribution is skewed to the right and the majority of the data is on the left, since the tail of the graph extends to the right this shows that the median is used to determine the centre and use the five number summary to determine the variation.
Thus, the adults typically have more money in the pockets and amount may vary.
Explanation of Solution
Given:
The given diagram is shown in Figure 2
Figure 2
Calculation:
The distribution is skewed to the right and the majority of the data is on the left, since the tail of the graph extends to the right this shows that the median is used to determine the centre and use the five number summary to determine the variation.
Thus, the adults typically have more money in the pockets and amount may vary.
Chapter 7 Solutions
BIG IDEAS MATH Integrated Math 1: Student Edition 2016


 Discrete Mathematics and Its Applications ( 8th I...MathISBN:9781259676512Author:Kenneth H RosenPublisher:McGraw-Hill Education
 Mathematics for Elementary Teachers with Activiti...MathISBN:9780134392790Author:Beckmann, SybillaPublisher:PEARSON
 Thinking Mathematically (7th Edition)MathISBN:9780134683713Author:Robert F. BlitzerPublisher:PEARSON
 Discrete Mathematics With ApplicationsMathISBN:9781337694193Author:EPP, Susanna S.Publisher:Cengage Learning,
 Pathways To Math Literacy (looseleaf)MathISBN:9781259985607Author:David Sobecki Professor, Brian A. MercerPublisher:McGraw-Hill Education