
Concept explainers
Videos
(a)
The mean, median and mode of the given data.
(a)
Answer to Problem 39E
Explanation of Solution
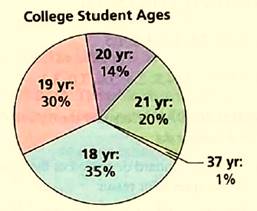
Given:
The given data set is:

Calculation:
The frequency of the data set will be:
Hence, the data set is:
The value of mean, median mode will be:
(b)
The outliers and the effect of outliers on mean, median and mode.
(b)
Answer to Problem 39E
Outlier = 2.
Mean and median will decrease and mode remains the same.
Explanation of Solution
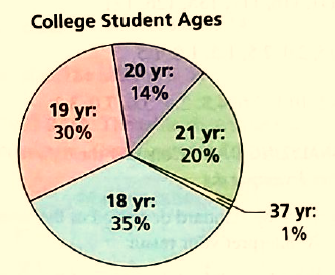
Given:
The given data set is:
Calculation:
Hence, the data set is:
Outlier = 2.
The value of new mean, median mode will be:
Mean and median will decrease and mode remains the same.
(c)
The circle graph with the mentioned changes.
(c)
Answer to Problem 39E
The mean, median and mode will be the Psychology I class.
Explanation of Solution
Given:
The given data set is:
Calculation:
All students take the Psychology II class 1 year later.
The new circle graph will be:
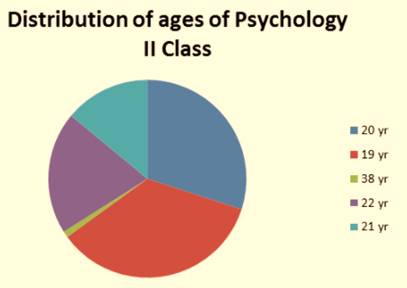
The mean, median and mode will be the Psychology I class.
Chapter 7 Solutions
BIG IDEAS MATH Integrated Math 1: Student Edition 2016


 Discrete Mathematics and Its Applications ( 8th I...MathISBN:9781259676512Author:Kenneth H RosenPublisher:McGraw-Hill Education
 Mathematics for Elementary Teachers with Activiti...MathISBN:9780134392790Author:Beckmann, SybillaPublisher:PEARSON
 Thinking Mathematically (7th Edition)MathISBN:9780134683713Author:Robert F. BlitzerPublisher:PEARSON
 Discrete Mathematics With ApplicationsMathISBN:9781337694193Author:EPP, Susanna S.Publisher:Cengage Learning,
 Pathways To Math Literacy (looseleaf)MathISBN:9781259985607Author:David Sobecki Professor, Brian A. MercerPublisher:McGraw-Hill Education