
Concept explainers
Videos
(a)
To Find: The classification of the shape of the distribution, or symmetric, skewed left or skewed right.
(a)
Answer to Problem 3CA
The shape is skewed to the right, the majority of the distribution to the left.
Given:
The given diagram is shown in Figure 1
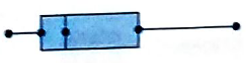
Figure 1
Calculation:
From figure 1 the majority of the data is on the left side of the plot. Since, the right whisker is on the longer on the left whisker this shows that the distribution is skewed on the right and the median is used to describe the centre and use the and use the five number summary to determine the variation.
(b)
To Find: The classification of the shape of the distribution, or symmetric, skewed left or skewed right.
The shape is skewed to the left, the majority of the distribution to the right.
Given:
The given diagram is shown in Figure 2
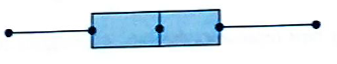
Figure 2
Calculation:
From figure 1 the majority of the data is on the right side of the plot. Since, the left whisker is on the longer on the right whisker this shows that the distribution is skewed on the left and the median is used to describe the centre and use the and use the five number summary to determine the variation.
(c)
To Find: The classification of the shape of the distribution, or symmetric, skewed left or skewed right.
The shape is skewed to the left, the majority of the distribution to the right.
Given:
The given diagram is shown in Figure 3
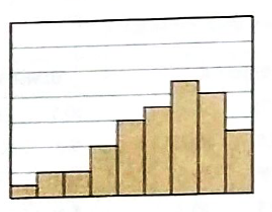
Figure 3
Calculation:
From figure 1 the majority of the data is on the right side of the plot. Since, the left whisker is on the longer on the right whisker this shows that the distribution is skewed on the left and the median is used to describe the centre and use the and use the five number summary to determine the variation.
(d)
To Find: The classification of the shape of the distribution, or symmetric, skewed left or skewed right.
The shape is skewed to the right, the majority of the distribution to the left.
Given:
The given diagram is shown in Figure 3
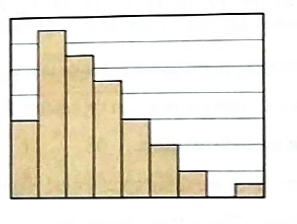
Figure 3
Calculation:
From figure 1 the majority of the data is on the left side of the plot. Since, the right whisker is on the longer on the left whisker this shows that the distribution is skewed on the right and the median is used to describe the centre and use the and use the five number summary to determine the variation.
Explanation of Solution
Given:
The given diagram is shown in Figure 1
Figure 1
Calculation:
From figure 1 the majority of the data is on the left side of the plot. Since, the right whisker is on the longer on the left whisker this shows that the distribution is skewed on the right and the median is used to describe the centre and use the and use the five number summary to determine the variation.
(b)
To Find: The classification of the shape of the distribution, or symmetric, skewed left or skewed right.
(b)
Answer to Problem 3CA
The shape is skewed to the left, the majority of the distribution to the right.
Given:
The given diagram is shown in Figure 2
Figure 2
Calculation:
From figure 1 the majority of the data is on the right side of the plot. Since, the left whisker is on the longer on the right whisker this shows that the distribution is skewed on the left and the median is used to describe the centre and use the and use the five number summary to determine the variation.
(c)
To Find: The classification of the shape of the distribution, or symmetric, skewed left or skewed right.
The shape is skewed to the left, the majority of the distribution to the right.
Given:
The given diagram is shown in Figure 3
Figure 3
Calculation:
From figure 1 the majority of the data is on the right side of the plot. Since, the left whisker is on the longer on the right whisker this shows that the distribution is skewed on the left and the median is used to describe the centre and use the and use the five number summary to determine the variation.
(d)
To Find: The classification of the shape of the distribution, or symmetric, skewed left or skewed right.
The shape is skewed to the right, the majority of the distribution to the left.
Given:
The given diagram is shown in Figure 3
Figure 3
Calculation:
From figure 1 the majority of the data is on the left side of the plot. Since, the right whisker is on the longer on the left whisker this shows that the distribution is skewed on the right and the median is used to describe the centre and use the and use the five number summary to determine the variation.
Explanation of Solution
Given:
The given diagram is shown in Figure 2
Figure 2
Calculation:
From figure 1 the majority of the data is on the right side of the plot. Since, the left whisker is on the longer on the right whisker this shows that the distribution is skewed on the left and the median is used to describe the centre and use the and use the five number summary to determine the variation.
(c)
To Find: The classification of the shape of the distribution, or symmetric, skewed left or skewed right.
(c)
Answer to Problem 3CA
The shape is skewed to the left, the majority of the distribution to the right.
Given:
The given diagram is shown in Figure 3
Figure 3
Calculation:
From figure 1 the majority of the data is on the right side of the plot. Since, the left whisker is on the longer on the right whisker this shows that the distribution is skewed on the left and the median is used to describe the centre and use the and use the five number summary to determine the variation.
(d)
To Find: The classification of the shape of the distribution, or symmetric, skewed left or skewed right.
The shape is skewed to the right, the majority of the distribution to the left.
Given:
The given diagram is shown in Figure 3
Figure 3
Calculation:
From figure 1 the majority of the data is on the left side of the plot. Since, the right whisker is on the longer on the left whisker this shows that the distribution is skewed on the right and the median is used to describe the centre and use the and use the five number summary to determine the variation.
Explanation of Solution
Given:
The given diagram is shown in Figure 3
Figure 3
Calculation:
From figure 1 the majority of the data is on the right side of the plot. Since, the left whisker is on the longer on the right whisker this shows that the distribution is skewed on the left and the median is used to describe the centre and use the and use the five number summary to determine the variation.
(d)
To Find: The classification of the shape of the distribution, or symmetric, skewed left or skewed right.
(d)
Answer to Problem 3CA
The shape is skewed to the right, the majority of the distribution to the left.
Given:
The given diagram is shown in Figure 3
Figure 3
Calculation:
From figure 1 the majority of the data is on the left side of the plot. Since, the right whisker is on the longer on the left whisker this shows that the distribution is skewed on the right and the median is used to describe the centre and use the and use the five number summary to determine the variation.
Explanation of Solution
Given:
The given diagram is shown in Figure 3
Figure 3
Calculation:
From figure 1 the majority of the data is on the left side of the plot. Since, the right whisker is on the longer on the left whisker this shows that the distribution is skewed on the right and the median is used to describe the centre and use the and use the five number summary to determine the variation.
Chapter 7 Solutions
BIG IDEAS MATH Integrated Math 1: Student Edition 2016


 Discrete Mathematics and Its Applications ( 8th I...MathISBN:9781259676512Author:Kenneth H RosenPublisher:McGraw-Hill Education
 Mathematics for Elementary Teachers with Activiti...MathISBN:9780134392790Author:Beckmann, SybillaPublisher:PEARSON
 Thinking Mathematically (7th Edition)MathISBN:9780134683713Author:Robert F. BlitzerPublisher:PEARSON
 Discrete Mathematics With ApplicationsMathISBN:9781337694193Author:EPP, Susanna S.Publisher:Cengage Learning,
 Pathways To Math Literacy (looseleaf)MathISBN:9781259985607Author:David Sobecki Professor, Brian A. MercerPublisher:McGraw-Hill Education