Concept explainers
Videos
Problem Set
Enthalpy, Entropy, and Free Energy. The oxidation of glucose to carbon dioxide and water is represented by the following reaction, whether the oxidation occurs by combustion in the laboratory or by biological oxidation in living cells:
This reaction is highly exothermic, with an enthalpy change (ΔH) of –673 kcal/mol. As you know from Figure 5-9, ΔG for this reaction at 25°C is –686 kcal/mol, so the reaction is also highly exergonic.
(a) Explain in your own words what the ΔH and ΔG values mean. What do the negative signs mean in each case?
(b) What does it mean to say that the difference between the ΔG and ΔH values is due to entropy?
(c) Without doing any calculations, would ΔS for this reaction be positive or negative? Explain your answer.
(d) Now calculate ΔS for this reaction at 25°C. Does the calculated value agree in sign with your prediction in part c?
(e) What are the values of ΔG, ΔH, and ΔS for the reverse of the above reaction as carried out by a photosynthetic algal cell that is using CO2 and H2O to make C6H12O6?
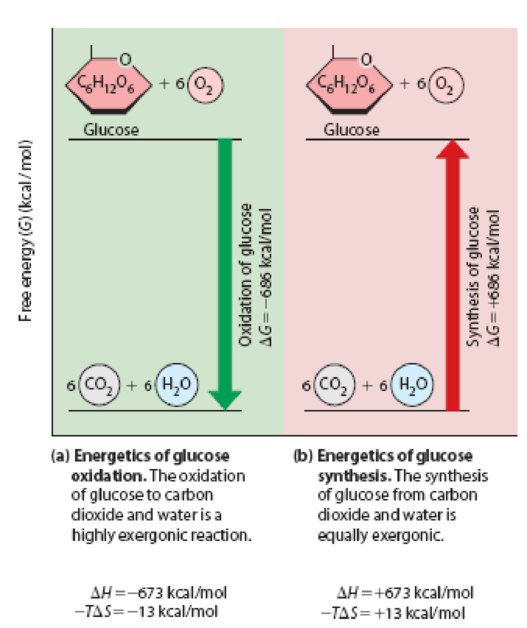
Figure 5-9 Changes in Free Energy for the Oxidation and Synthesis of Glucose. The exergonic oxidation of glucose shown in (a) has a large negative ΔG that is exactly equal in magnitude but opposite in sign to the large positive ΔG for the endergonic synthesis of glucose shown in (b).
Want to see the full answer?
Check out a sample textbook solution
Chapter 5 Solutions
Becker's World of the Cell (9th Edition)


- Initial rate data for an enzyme that obeys Michaelis–Menten kinetics areshown in the following table. When the enzyme concentration is 3 nmolml-1, a Lineweaver–Burk plot of this data gives a line with a y-intercept of0.00426 (μmol-1 ml s). (a) Calculate kcat for the reaction.(b) Calculate KM for the enzyme.(c) When the reactions in part (b) are repeated in the presence of 12 μM ofan uncompetitive inhibitor, the y-intercept of the Lineweaver–Burk plotis 0.352 (μmol-1 ml s). Calculate K′I for this inhibitor.arrow_forwardAnswer for the number 7 question, Thank you. No need for long explanation.arrow_forwardquestion is attachedarrow_forward
- Matching Question: Researchers characterized a new enzyme and determined its Km=200 uM. Moreover, they found that at (Etotad10 nM this enzyme reaches maximum reaction velocity Venasa5 is 1. What is the keat of this enzyme? 2. At which concentration of the substrate this enzyme reaches initial reaction velocity (Vo) of 500 nM/s (assuming (Etotal is the same 10 nMy? 3. What is the maximum reaction velocity (Vmax) of the reaction catalyzed by this enzyme at (Etotail4 nM? Make sure to choose the correct units of measure. Note that some of the items from the answer list should NOT be used. v kcat 1. 400 uM - (S] - - Vmax 2 100 uM 500 s 450 uM 250 s1 * 501 7. so00 s 1 UM's SuMis 10 200 uM 11. 10 uMis 12 25 s 13. 500 nM/sarrow_forwardEnzyme Kinetics question Enzyme used is 10uL of a 10 ng/uL solution to a reaction mix in a final volume of 2.0 mL. (Enzyme used is 20kDa monomeric enzyme if matters) Based off lineweaver burk where 300 uM of inhibitor is used noninhibited formula is y= 4x + 0.1 (x axis is 1/S 1/mM) (y axis is 1/Vo sec/mM) inhibited formula is y = 4x + 1 I found Km as 1 mM for inhibited Vmax as 1mM/sec for inhibited How would I find Kcat? How would I find Ki?arrow_forwardMATHEMATICAL For an enzyme that displays MichaelisMenten kinetics, what is the reaction velocity, V (as a percentage of Vmax), observed at the following values? (a) [S]=KM (b) [S]=0.5KM (c) [S]=0.1KM (d) [S]=2KM (e) [S]=10KMarrow_forward
- MATHEMATICAL If a reaction can be written AB, and the G is 20kJmol1, what would the substrate/product ratio have to be for the reaction to be thermodynamically favorable?arrow_forwardActivity, Enzyme Kinetics Biol 250, Spring 2022 The initial rate for an enzyme-catalyzed reaction has been determined at a number of substrate concentrations. Data are as follows: [S] (umol/L) V [(µmol/L) min1] 5 22 10 39 20 65 50 102 100 120 200 135 (a) Estimate Vmax and KM from a direct graph of v versus [S]. Do you find difficulties in getting clear answers? (b) Now use a Lineweaver-Burk plot to analyze the same data. Does this work better? (c) Finally, try an Eadie-Hofstee plot of the same data. (d) If the total enzyme concentration was 1 nmol/L, how many molecules of substrate can a molecule of enzyme process in each minute? (e) Calculate kcat/KM for the enzyme reaction. Is this a fairly efficient enzyme?arrow_forwardENZYME KINETICS ANALYSIS of 6 Xanthine oxidase (XO) is the enzyme that catalyzes the synthesis of uric acid, which in excess causes gouty arthritis. The inhibition of this enzyme is therefore critical in its treatment. A student researcher is investigating the inhibitory effects of kaempferol (Kmp) and chlorogenic acid (Cha) on XO which uses xanthine (Xan) as substrate. Table 1 below shows the enzyme kinetic data. Construct the Lineweaver-Burk plot complete with the linear regression analvsis. Fill in the needed information on Table 2 and paste a copy of your Lineweaver-Burk plot. submit the picture of your output in PNG or JPG format. Table 1. Enzyme Kinetic Data Velocity, mM/s [S], mM Хan Kmp Cha 0.492 0.0678 0.0351 0.0615 0.211 0.0531 0.0261 0.0451 0.087 0.0298 0.0157 0.0211 0.048 0.0195 0.0091 0.0142 0.029 0.0127 0.0067 0.0081 Table 2. Enzyme Kinetic Parameters Xanthine Kaempferol Chlorogenic acid Parameters Vmax Км Type of Inhibition Mode of Binding NA NA Lineweaver-Burk Plotarrow_forward
- Solve correctly please. Should correctarrow_forwardPlease show all work/answers for 1 (d-g)arrow_forwardProblem: Alcohol Dehydrogenase catalyzes the conversion of ethanol to acetaldehyde. This enzyme, in its active state, consists of a protein molecule and a zinc ion. On the basis of this information, identify the following for this chemical system. Substrate Apoenzyme Cofactor Holoenzymearrow_forward
 BiochemistryBiochemistryISBN:9781305961135Author:Mary K. Campbell, Shawn O. Farrell, Owen M. McDougalPublisher:Cengage Learning
 BiochemistryBiochemistryISBN:9781305577206Author:Reginald H. Garrett, Charles M. GrishamPublisher:Cengage Learning