
Concept explainers
Videos
(a)
To find: the
(a)
Answer to Problem 47E
Median is 239, IQR is 9, Mean is 237.6 and Standard deviation is 5.7
Explanation of Solution
Given:


Calculation:
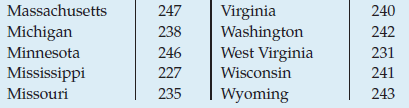
Median is the mid number of an ordered data set. Here data display mathematics achievement scores for eight graders in all 50 states that even number of values in data set so median is average of 25th and 26th values. 25th values is 239 and 26th value is also 239 so the median is 239.
To find IQR let us fist find
Lower half of data has 25 values so the lower quartile is
Upper quartile is middle value of upper half. Upper half of data has 25 values so the upper quartile is
Therefore IQR is
So standard deviation would be
Hence for state averages: median is 239, IQR is 9, Mean is 237.6 and Standard deviation is 5.7.
(b)
To Explain: the summary statistics would report for these data.
(b)
Explanation of Solution
Given:

Graph:
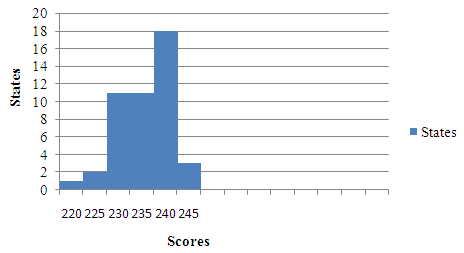
By seeing the histogram, it is noticed that it appears that the distribution is skewed to left. Whenever the distribution is skewed that time it would be better to use median as the measure of centre of the distribution and IQR as the measure of spread of the distribution.
(c)
To Explain: the brief summary of the performance of eighth graders nationwide.
(c)
Explanation of Solution
Given:
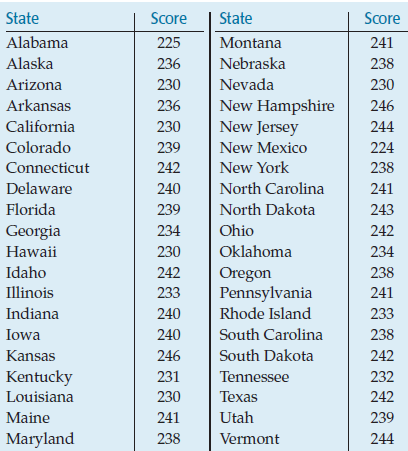

By seeing the distribution, it is observed that it is skewed to the left or negatively skewed and is looks to unimodal. Almost 20 states have scores between 240 and 244. One of the states has the less than 225 scores and 2 states have scores between the 225 and 229. Almost 4 states have scores greater than the
Chapter 4 Solutions
Stats: Modeling the World Nasta Edition Grades 9-12
Additional Math Textbook Solutions
Statistics: The Art and Science of Learning from Data (4th Edition)
Introductory Statistics
Elementary Statistics
Fundamentals of Statistics (5th Edition)
Essentials of Statistics, Books a la Carte Edition (5th Edition)


 MATLAB: An Introduction with ApplicationsStatisticsISBN:9781119256830Author:Amos GilatPublisher:John Wiley & Sons Inc
 Probability and Statistics for Engineering and th...StatisticsISBN:9781305251809Author:Jay L. DevorePublisher:Cengage Learning
 Statistics for The Behavioral Sciences (MindTap C...StatisticsISBN:9781305504912Author:Frederick J Gravetter, Larry B. WallnauPublisher:Cengage Learning
 Elementary Statistics: Picturing the World (7th E...StatisticsISBN:9780134683416Author:Ron Larson, Betsy FarberPublisher:PEARSON
 The Basic Practice of StatisticsStatisticsISBN:9781319042578Author:David S. Moore, William I. Notz, Michael A. FlignerPublisher:W. H. Freeman
 Introduction to the Practice of StatisticsStatisticsISBN:9781319013387Author:David S. Moore, George P. McCabe, Bruce A. CraigPublisher:W. H. Freeman