
Concept explainers
Videos
(a)
To Explain: the
(a)
Explanation of Solution
Given:

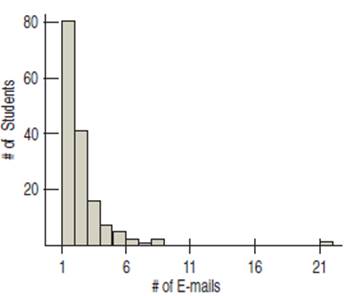
Average of the data list is known as the mean, whereas the middle number of a data list dividing the higher half from the lower half is called the median. it requires to find whether the mean or the median is larger. The mean is greater than the median because the histogram is skewed to the right.
(b)
To Explain: the few sentences describing this distribution.
(b)
Explanation of Solution
Given:

It is require explaining the histogram in reference to its shape, centre and spread and any unusual feature. The distribution is positively skewed or skewed to the right, it represent that the data is not evenly distributed and it represent a longer tail to the right. The spread of the data is between 1 to 21 e-mails. There is an outlier because there is nothing between 9 and 20 e-mails.
(c)
To Explain: the summary statistics would select to summarize the centre and spread in these data.
(c)
Explanation of Solution
Given:
By seeing the histogram, it is observed that the distribution is the histogram is skewed to the right or not symmetric so the median instead of the mean and inter
Chapter 4 Solutions
Stats: Modeling the World Nasta Edition Grades 9-12
Additional Math Textbook Solutions
Statistics for Psychology
STATS:DATA+MODELS-W/DVD
Intro Stats, Books a la Carte Edition (5th Edition)
Essentials of Statistics (6th Edition)
Elementary Statistics
Statistics: The Art and Science of Learning from Data (4th Edition)


 MATLAB: An Introduction with ApplicationsStatisticsISBN:9781119256830Author:Amos GilatPublisher:John Wiley & Sons Inc
 Probability and Statistics for Engineering and th...StatisticsISBN:9781305251809Author:Jay L. DevorePublisher:Cengage Learning
 Statistics for The Behavioral Sciences (MindTap C...StatisticsISBN:9781305504912Author:Frederick J Gravetter, Larry B. WallnauPublisher:Cengage Learning
 Elementary Statistics: Picturing the World (7th E...StatisticsISBN:9780134683416Author:Ron Larson, Betsy FarberPublisher:PEARSON
 The Basic Practice of StatisticsStatisticsISBN:9781319042578Author:David S. Moore, William I. Notz, Michael A. FlignerPublisher:W. H. Freeman
 Introduction to the Practice of StatisticsStatisticsISBN:9781319013387Author:David S. Moore, George P. McCabe, Bruce A. CraigPublisher:W. H. Freeman