
Concept explainers
Videos
(a)
To Explain: the distribution.
(a)
Explanation of Solution
Given:

By seeing the histogram, it is observed that the distribution is centred at about 290, with a standard deviation of about 10. The distribution looks normal (bell-shaped). The peak is at 290, and the standard spread looks to be about 10.
(b)
To find: the proportion of professional male golfers that is less than 280 yards.
(b)
Answer to Problem 22E
15%
Explanation of Solution
Given:

Calculation:
About 15%
Approximately 30 professional male golfers which is less than 280 yards therefore the proportion of professional male golfers drive on average less than 280 yard is
30 (20+5+3+1=29, take it 30 approximately.)
There are 202 golfers total.
(c)
To Calculate: the
(c)
Answer to Problem 22E
287.5
Explanation of Solution
Given:

The mean is approximately 287.5
The data is largely normal (bell-shaped). The mean is about where the peak is lie.
(d)
To Explain: that expect the mean to be smaller, equal or larger than the
(d)
Explanation of Solution
Given:
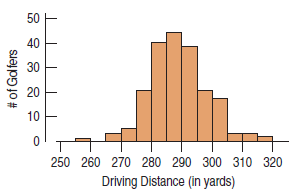
The mean would be about equal to the median. The histogram appears to be
Chapter 4 Solutions
Stats: Modeling the World Nasta Edition Grades 9-12
Additional Math Textbook Solutions
Basic Business Statistics, Student Value Edition (13th Edition)
Elementary Statistics: Picturing the World (6th Edition)
Statistical Reasoning for Everyday Life (5th Edition)
Statistics: The Art and Science of Learning from Data (4th Edition)
Introductory Statistics (2nd Edition)
Introductory Statistics (10th Edition)


 MATLAB: An Introduction with ApplicationsStatisticsISBN:9781119256830Author:Amos GilatPublisher:John Wiley & Sons Inc
 Probability and Statistics for Engineering and th...StatisticsISBN:9781305251809Author:Jay L. DevorePublisher:Cengage Learning
 Statistics for The Behavioral Sciences (MindTap C...StatisticsISBN:9781305504912Author:Frederick J Gravetter, Larry B. WallnauPublisher:Cengage Learning
 Elementary Statistics: Picturing the World (7th E...StatisticsISBN:9780134683416Author:Ron Larson, Betsy FarberPublisher:PEARSON
 The Basic Practice of StatisticsStatisticsISBN:9781319042578Author:David S. Moore, William I. Notz, Michael A. FlignerPublisher:W. H. Freeman
 Introduction to the Practice of StatisticsStatisticsISBN:9781319013387Author:David S. Moore, George P. McCabe, Bruce A. CraigPublisher:W. H. Freeman