
Concept explainers
Videos
(a)
To find: the time does expect a typical movie to run.
(a)
Answer to Problem 21E
100 minutes
Explanation of Solution
Given:

By seeing the histogram, it is observed that the
(b)
To find: that movie ran for 2.5 hours.
(b)
Answer to Problem 21E
Yes
Explanation of Solution
Given:
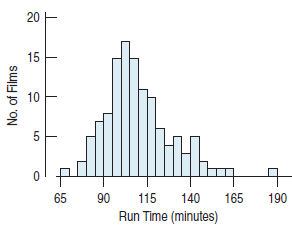
150 minutes is on the high side of the movie time length, where not unheard of, it is somewhat outside of the standard deviation. It is surprised that movie ran for 150 minutes.
(c)
To find: the expected to be higher the mean or the
(c)
Answer to Problem 21E
Mean
Explanation of Solution
Given:

By seeing the distribution, it is observed that is not symmetric. It has an outlier and skewed to right side highly, so the median would be good measure of the centre of the distribution. Median looks the data better than mean. The distribution would be skewed to right therefore the mean would be higher than median.
Chapter 4 Solutions
Stats: Modeling the World Nasta Edition Grades 9-12
Additional Math Textbook Solutions
Elementary Statistics
Introductory Statistics (10th Edition)
Statistics: The Art and Science of Learning from Data (4th Edition)
Essentials of Statistics, Books a la Carte Edition (5th Edition)
Basic Business Statistics, Student Value Edition


 MATLAB: An Introduction with ApplicationsStatisticsISBN:9781119256830Author:Amos GilatPublisher:John Wiley & Sons Inc
 Probability and Statistics for Engineering and th...StatisticsISBN:9781305251809Author:Jay L. DevorePublisher:Cengage Learning
 Statistics for The Behavioral Sciences (MindTap C...StatisticsISBN:9781305504912Author:Frederick J Gravetter, Larry B. WallnauPublisher:Cengage Learning
 Elementary Statistics: Picturing the World (7th E...StatisticsISBN:9780134683416Author:Ron Larson, Betsy FarberPublisher:PEARSON
 The Basic Practice of StatisticsStatisticsISBN:9781319042578Author:David S. Moore, William I. Notz, Michael A. FlignerPublisher:W. H. Freeman
 Introduction to the Practice of StatisticsStatisticsISBN:9781319013387Author:David S. Moore, George P. McCabe, Bruce A. CraigPublisher:W. H. Freeman