
Videos
To Explain: the appropriate graphical displays and summary statistics.
Explanation of Solution
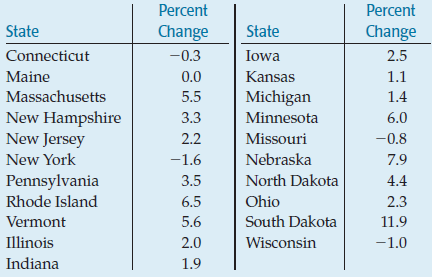
Given:
Calculation:
-1.6, -1, -0.8, -0.3, 0, 1.1, 1.4, 1.9, 2, 2.2, 2.3, 2.5, 3.3, 3.5, 4.4, 5.5, 5.6, 6, 6.5, 7.9, 11.9
These are 21 values so median is 11th value. So median will be
Median = 2.3%
So standard deviation would be
So standard deviation is 3.3%
IQR
To find IQR let us first find
Lower half of data has 11 values (including median). Lower half of information
-1.6, -1, -0.8, -0.3, 0, 1.1, 1.4, 1.9, 2, 2.2, 2.3
The lower quartile is 6th value. So
Upper half of data has 25 values. upper half of data is
2.3, 2.5, 3.3, 3.5, 4.4, 5.5, 5.6, 6, 6.5, 7.9, 11.9
The upper quartile is 6th value. So
Therefore IQR is
Graph:
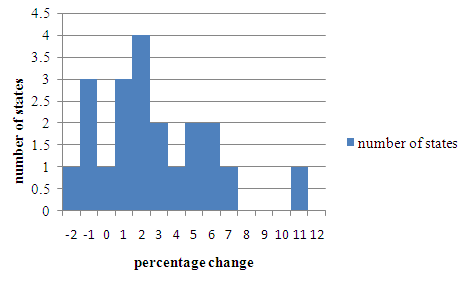
Median and mean of the data is 2.3% and 3.1% respectively. Distribution is skewed to right. So median works as a good measure of centre of distribution in comparison of mean. There is an outlier also means in one state percent change is around 11.9% which is higher than any other state.
Chapter 4 Solutions
Stats: Modeling the World Nasta Edition Grades 9-12
Additional Math Textbook Solutions
STATS:DATA+MODELS-W/DVD
Intro Stats
Introductory Statistics (2nd Edition)
Introductory Statistics (10th Edition)
Intro Stats, Books a la Carte Edition (5th Edition)


 MATLAB: An Introduction with ApplicationsStatisticsISBN:9781119256830Author:Amos GilatPublisher:John Wiley & Sons Inc
 Probability and Statistics for Engineering and th...StatisticsISBN:9781305251809Author:Jay L. DevorePublisher:Cengage Learning
 Statistics for The Behavioral Sciences (MindTap C...StatisticsISBN:9781305504912Author:Frederick J Gravetter, Larry B. WallnauPublisher:Cengage Learning
 Elementary Statistics: Picturing the World (7th E...StatisticsISBN:9780134683416Author:Ron Larson, Betsy FarberPublisher:PEARSON
 The Basic Practice of StatisticsStatisticsISBN:9781319042578Author:David S. Moore, William I. Notz, Michael A. FlignerPublisher:W. H. Freeman
 Introduction to the Practice of StatisticsStatisticsISBN:9781319013387Author:David S. Moore, George P. McCabe, Bruce A. CraigPublisher:W. H. Freeman