
Concept explainers
Videos
(a)
To Explain: on the basis of given histogram.
(a)
Explanation of Solution
Given:
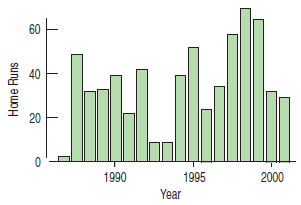
By seeing the histogram, it is observed that the there are only 16 years from 1986 to 2001 (inclusive), which implies that there should be only 16 bars. Although, it is appears to be 18 bars in total.
(b)
To construct: the own histogram on the basis of given data.
(b)
Explanation of Solution
Given:

Graph:
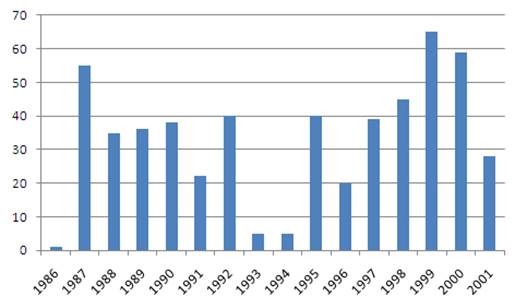
On the basis of given histogram, plot the histogram which is not symmetric and there is only 16 bars according to years which is correct.
Chapter 4 Solutions
Stats: Modeling the World Nasta Edition Grades 9-12
Additional Math Textbook Solutions
Statistics for Business and Economics (13th Edition)
An Introduction to Mathematical Statistics and Its Applications (6th Edition)
Introductory Statistics
Elementary Statistics: Picturing the World (7th Edition)
Statistics for Psychology
Elementary Statistics Using Excel (6th Edition)


 MATLAB: An Introduction with ApplicationsStatisticsISBN:9781119256830Author:Amos GilatPublisher:John Wiley & Sons Inc
 Probability and Statistics for Engineering and th...StatisticsISBN:9781305251809Author:Jay L. DevorePublisher:Cengage Learning
 Statistics for The Behavioral Sciences (MindTap C...StatisticsISBN:9781305504912Author:Frederick J Gravetter, Larry B. WallnauPublisher:Cengage Learning
 Elementary Statistics: Picturing the World (7th E...StatisticsISBN:9780134683416Author:Ron Larson, Betsy FarberPublisher:PEARSON
 The Basic Practice of StatisticsStatisticsISBN:9781319042578Author:David S. Moore, William I. Notz, Michael A. FlignerPublisher:W. H. Freeman
 Introduction to the Practice of StatisticsStatisticsISBN:9781319013387Author:David S. Moore, George P. McCabe, Bruce A. CraigPublisher:W. H. Freeman