
Videos
(a)
To construct: the stem and leaf plot on basis of given data.
(a)
Explanation of Solution
Given:
228, 178, 186, 162, 206, 166, 163, 183, 181, 206, 177, 175, 167, 162, 160, 160, 157, 156, 153, 153, 152
Graph:
Stem unit = 10
Leaf unit = 1

By seeing the distribution, it is observed that the distribution is not symmetric distribution the reason is that the distribution is skewed to right and has outliers so
(b)
To Explain: the distribution and overall shape and unusual features.
(b)
Answer to Problem 36E
Right skewed
Explanation of Solution
Given:
228, 178, 186, 162, 206, 166, 163, 183, 181, 206, 177, 175, 167, 162, 160, 160, 157, 156, 153, 153, 152
Graph:
Stem unit = 10
Leaf unit = 1
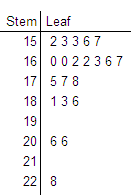
By seeing the distribution, it is observed that the distribution is skewed to the right although the most of the data points are on the. All but three numbers are over 200 and the number 228 might be an outlier. There are total 21 numbers of the data list so the median is 11th position. So the median is 166 birds.
Chapter 4 Solutions
Stats: Modeling the World Nasta Edition Grades 9-12
Additional Math Textbook Solutions
Introductory Statistics
Basic Business Statistics, Student Value Edition
Elementary Statistics: Picturing the World (6th Edition)
Introductory Statistics (10th Edition)
An Introduction to Mathematical Statistics and Its Applications (6th Edition)


 MATLAB: An Introduction with ApplicationsStatisticsISBN:9781119256830Author:Amos GilatPublisher:John Wiley & Sons Inc
 Probability and Statistics for Engineering and th...StatisticsISBN:9781305251809Author:Jay L. DevorePublisher:Cengage Learning
 Statistics for The Behavioral Sciences (MindTap C...StatisticsISBN:9781305504912Author:Frederick J Gravetter, Larry B. WallnauPublisher:Cengage Learning
 Elementary Statistics: Picturing the World (7th E...StatisticsISBN:9780134683416Author:Ron Larson, Betsy FarberPublisher:PEARSON
 The Basic Practice of StatisticsStatisticsISBN:9781319042578Author:David S. Moore, William I. Notz, Michael A. FlignerPublisher:W. H. Freeman
 Introduction to the Practice of StatisticsStatisticsISBN:9781319013387Author:David S. Moore, George P. McCabe, Bruce A. CraigPublisher:W. H. Freeman