
Concept explainers
Videos
Compare the mean compressive strength at each rodding level from Exercise 4.37 with a scaled t distribution. What conclusions would you draw from this plot?
4.37. An article in the ACI Materials Journal (Vol. 84, 1987, pp. 213–216) describes several experiments investigating the rodding of concrete to remove entrapped air. A 3-in.-diameter cylinder was used, and the number of times this rod was used is the design variable. The resulting compressive strength of the concrete specimen is the response. The data are shown in Table 4E.5.
TABLE 4E.5
Compressive Strength Data for Exercise 4.37
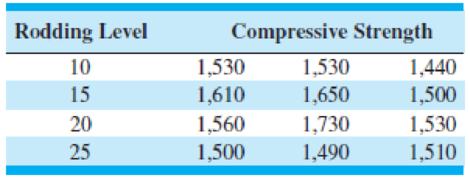
- (a) Is there any difference in compressive strength due to the rodding level? Answer this question by using the analysis of variance with α = 0.05.
- (b) Construct box plots of compressive strength by rodding level. Provide a practical interpretation of these plots.
- (c) Construct a normal probability plot of the residuals from this experiment. Does the assumption of a
normal distribution for compressive strength seem reasonable?
Want to see the full answer?
Check out a sample textbook solution
Chapter 4 Solutions
Introduction to Statistical Quality Control
Additional Math Textbook Solutions
Elementary Statistics Using the TI-83/84 Plus Calculator, Books a la Carte Edition (4th Edition)
Introductory Statistics (2nd Edition)
Research Methods for the Behavioral Sciences (MindTap Course List)
Elementary Statistics: Picturing the World (6th Edition)
Elementary Statistics
Statistics for Business & Economics, Revised (MindTap Course List)


- An experiment was conducted to determine the effect of type of fertilizer on the growth of a certain plant. Three types of fertilizers were tried. The data for growth of the plants (cm) measured after 3 months from the date of seedling is given 1 12.4 13.1 11.1 12.2 11.3 12.1 Type of fertilizer 2 16.1 16.4 17.2 16.6 17.1 16.8 3 31.5 30.4 31.6 32.1 31.8 30.9 Dr. Asieh Abtahl-Faculty of Mathematics and Statistics - Islamic Azad University of Shiraz-Iran (a) Determine the response variable, factors (kind of factor), level, number of treatments, number of replications, number of experiments. (b) Determine the type of design experiment. (c) Write the model of design experiment. (e) Test whether the type of fertilizer has an effect on the growth of the plants. Use α = 0.05. (f) Construct a 99 percent confidence interval estimate of the mean response for fertilizer 2 (g) Which fertilizer have different effect? h- Use Tukey's test to compare pairs of treatment means. Use α = 0.01.arrow_forwardHealth care workers who use latex gloves with glove powder on a daily basis are particularly susceptible to developing a latex allergy. Each in a sample of 44 hospital employees who were diagnosed with a latex allergy based on a skin-prick test reported on their exposure to latex gloves. Summary statistics for the number of latex gloves used per week are x= 19.4 and s = 11.7. Complete parts (a) - (d). a. Give a point estimate for the average number of latex gloves used per week by all health care workers with a latex allergy. b. Form a 95% confidence interval for the average number of latex gloves used per week by all health care workers with a latex allergy. (Use integers or decimals for any numbers in the expression. Round to two decimal places as needed.) c. Give a practical interpretation of the interval, part (b). O A. One can be 95% confident that latex gloves cause allergies for all who use a number of gloves contained in the interval. O B. One can be 95% confident that the…arrow_forwardA purchasing agent obtained 60 watt bulbs from two companies. He has the samples tested in his laboratory for the length of the life with the following results: Length of Life (in hours) 1700 and under 1900 1900 and under 2100 2100 and under 2300 2300 and under 2500 2500 and under 2700 Соmpany A Соmpany B 12 3 14 30 20 17 8 6 2 a. Which Company's bulb do you think are better in terms of average life? b. If price of both types are the same, which company's bulbs would you buy and why? ( Coefficient of variation is Mean /Standard deviation **100)arrow_forward
- Eyeglassomatic manufactures eyeglasses for different retailers. They test to see how many defective lenses they made in a time period. Table #4.2.2 gives the defect and the number of defects. Table #4.2.2: Number of Defective Lenses Defect type Number of defects Scratch 5865 Right shaped – small 4613 Flaked 1992 Wrong axis 1838 Chamfer wrong 1596 Crazing, cracks 1546 Wrong shape 1485 Wrong PD 1398 Spots and bubbles 1371 Wrong height 1130 Right shape – big 1105 Lost in lab 976 Spots/bubble – intern 976 Find the probability of picking a lens that is scratched or flaked. Find the probability of picking a lens that is the wrong PD or was lost in lab. Find the probability of picking a lens that is not scratched. Find the probability of picking a lens that is not the wrong shape.arrow_forwardAn experiment was carried out to compares the time (in hours) it takes an engine to run on five (5) liters of petrol. Three makes of engine of the same capacity and running at the same speed were used in the experiment. The resulting data is given in the table below. ENGINE MAKE 12.5 11.5 17.5 13.0 12.3 18.0 12.4 13.0 17.3 13.1 13.2 18.2 What is the experimental design? Which are the treatments? Carry out the appropriate analysis and test the null hypothesis at 5% level of significance. Obtain the 95% confidence interval for engine make C.arrow_forwardAn experiment was carried out to compares the time (in hours) it takes an engine to run on five (5) liters of petrol. Three makes of engine of the same capacity and running at the same speed were used in the experiment. The resulting data is given in the table below. ENGINE MAKE A 12.5 11.5 17.5 13.0 12.3 18.0 12.4 13.0 17.3 13.1 13.2 18.2 What is the experimental design? Which are the treatments? Carry out the appropriate analysis and test the null hypothesis at 5% level ofarrow_forward
- What percentage of women that did not receive the treatment showed hair growth of 1-2 inches? Answer: Blank 1: Blank 2: Blank 3: Blank 4: Chp -> & #3 $4 9. 8 6. 3 4. y earrow_forwardHealth care workers who use latex gloves with glove powder on a daily basis are particularly susceptible to developing a latex allergy. Each in a sample of 47 hospital employees who were diagnosed with a latex allergy based on a skin-prick test reported on their exposure to latex gloves. Summary statistics for the number of latex gloves used per week are x = 19.7 and s = 12.1. Complete parts (a)-(d). a. Give a point estimate for the average number of latex gloves used per week by all health care workers with a latex allergy. 19.7 b. Form a 95% confidence interval for the average number of latex gloves used per week by all health care workers with a latex allergy. (16.24, 23.16) (Use integers or decimals for any numbers in the expression. Round to two decimal places as needed.) c. Give a practical interpretation of the interval, part (b). OA. One can be 95% confident that the average number of latex gloves used per week by all healthcare workers with latex allergy is greater than the…arrow_forwardLecture(8.8): The amount of time people engage in physical activity mat be related to health outcome. Those who report that they spend more than 15 hours are put into one while those who spend less 10 were put into another group. (Those who fall in between 10 and 15 were left out of the study); The reaearcher then ask the participants to wear a monitor for one month. The average time in minutes is recorded and shown below . Is there any evidence that on average people who watch less than 10 hours watching televsion spend more time on physical activity.?. Test the hypotheses at (alpha=0.05) using the 5 step procedure <10 hours 75 63 118 35 82 >15 hours 62 6 78 43 22 33arrow_forward
- Lecture(11.14): A professor offered a course half online and half in person.The professor hypothesized that students were spending less time engaged with course during online than in person,At the end of the semester students were asked to provide the amount of time they tended in a week. The weeks were classified as online or in person and the average amount of time for 15 weeks is given below. Online: 4 3 5 6 2 2 4 7 5 4 3 2 6 6 3 In person: 5 5 4 7 3 4 4 6 4 5 3 4 5 8 4 Test the hypotheses at (alpha= 0.05) level of significance using the 5 step hypotheses testing. Make sure you clesrly state the null and alternative hypotheses. Round your answer to 2 decimal places; person. and the average amount of time spent for 15 studentsarrow_forwardYou are interested in exploring gender differences in sentence length for convicted sex offenders. You take a sample of 18 male sex offenders and a sample of 13 female sex offenders and compute the average sentence length for each group in years. Based on the information below, is there a significant difference between males and females in the average sentence length for convicted sex offenders? Use alpha = .10. %3D Males: Females: n = 18 n = 13 M= 26.3 SS = 880 M = 21.7 SS = 610 Step 1: 2a. Identify the null hypothesis. Type a - f here a. Ho: Hm = Hf %3D b. Ho: Hm # Hf c. Ho: Hm 2 Hf d. Ho: Hm SHf e. Ho: m > Hf f. Ho: Hm Hf f. Hj: Hm < Hr Step 2: 2c. Type in your df here:arrow_forwardHealth care workers who use latex gloves with glove powder on a daily basis are particularly susceptible to developing a latex allergy. Each in a sample of 45 hospital employees who were diagnosed with a latex allergy based on a skin-prick test reported on their exposure to latex gloves. Summary statistics for the number of latex gloves used per week are x = 19.5 and s = 12.1. Complete parts (a) - (d). a. Give a point estimate for the average number of latex gloves used per week by all health care workers with a latex allergy. 19.5 b. Form a 95% confidence interval for the average number of latex gloves used per week by all health care workers with a latex allergy. (Use integers or decimals for any numbers in the expression. Round to two decimal places as needed.)arrow_forward
 Glencoe Algebra 1, Student Edition, 9780079039897...AlgebraISBN:9780079039897Author:CarterPublisher:McGraw Hill