
Videos
Two different hardening processes—(1) saltwater quenching and (2) oil quenching—are used on samples of a particular type of metal alloy. The results are shown in Table 4E.2. Assume that hardness is
(a) Test the hypothesis that the
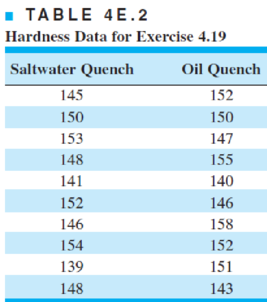
hardness for the oil quenching process. Use
(b) Assuming that the variances
(c) Construct a 95% confidence interval on the ratio
(d) Does the assumption of normality seem appropriate for these data?
Want to see the full answer?
Check out a sample textbook solution
Chapter 4 Solutions
Introduction to Statistical Quality Control
Additional Math Textbook Solutions
Intro Stats, Books a la Carte Edition (5th Edition)
STATS:DATA+MODELS-W/DVD
Introductory Statistics (2nd Edition)
STATISTICS F/BUSINESS+ECONOMICS-TEXT
Fundamentals of Statistics (5th Edition)


- Respiratory Rate Researchers have found that the 95 th percentile the value at which 95% of the data are at or below for respiratory rates in breath per minute during the first 3 years of infancy are given by y=101.82411-0.0125995x+0.00013401x2 for awake infants and y=101.72858-0.0139928x+0.00017646x2 for sleeping infants, where x is the age in months. Source: Pediatrics. a. What is the domain for each function? b. For each respiratory rate, is the rate decreasing or increasing over the first 3 years of life? Hint: Is the graph of the quadratic in the exponent opening upward or downward? Where is the vertex? c. Verify your answer to part b using a graphing calculator. d. For a 1- year-old infant in the 95 th percentile, how much higher is the walking respiratory rate then the sleeping respiratory rate? e. f.arrow_forwardA sample of 100 grade 10 students age was obtained to estimate the mean of all grade 10 students. Given x = 15.3 years and the population variance is 16arrow_forwardRecords for the last 15 years have shown that the average rainfall in a certain region of the country, for the month of March, to be 1.20 inches, with s = 0.45 inches. A second region had an average rainfall of 1.35 inches, with s = 0.54. estimate the difference of the true average rainfalls in those two regions as a 95% C.I. with the assumption of normal populations and unequal variances.arrow_forward
- Suppose that contamination particle size (in microm- eters) can be modeled as f(x)=2x³ for 1 < x. Determine the mean of X. What can you conclude about the variance of X?arrow_forwardIn a certain type of metal test, the normal stress on a specimen is known to be functionally related to the shear resistance. What is the correlation between the two variables using Pearson product-moment correlation coefficient? Normal 27 29 26 28 28 24 Stress(x): 25 27 Shear 27 28 25 27 24 26 Resistance (y): 27 23 22 24arrow_forwardThe amount of chlorine in 100 cm3 water taken from a water tank was measured, the average was 2.15 mg was found. The expert claims that the amount of chlorine in the water is greater than that measured. For this reason, 100 households were randomly selected, with an average chlorine content of 2.55mg and a variance of 0.49 mg. According to this data, find the account value z.arrow_forward
 Calculus For The Life SciencesCalculusISBN:9780321964038Author:GREENWELL, Raymond N., RITCHEY, Nathan P., Lial, Margaret L.Publisher:Pearson Addison Wesley,