Plot the residuals from Exercise 4.36 against the firing temperatures. Is there any indication that variability in baked anode density depends on the firing temperature? What firing temperature would you recommend using?
4.36. Compare the mean etch uniformity values at each of the C2F6 flow rates from Exercise 4.33 with a scaled t distribution. Does this analysis indicate that there are differences in mean etch uniformity at the different flow rates? Which flows produce different results?
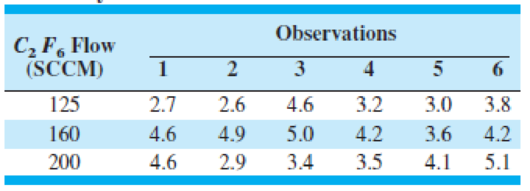
4.35. An article in Solid State Technology (May 1987) describes an experiment to determine the effect of C2F6 flow rate on etch uniformity on a silicon wafer used in integrated-circuit manufacturing. Three flow rates are tested, and the resulting uniformity (in percent) is observed for six test units at each flow rate. The data are shown in Table 4E.4.
- (a) Does C2F6 flow rate affect etch uniformity? Answer this question by using an analysis of variance with α = 0.05.
- (b) Construct a box plot of the etch uniformity data. Use this plot, together with the analysis of variance results, to determine which gas flow rate would be best in terms of etch uniformity (a small percentage is best).
- (c) Plot the residuals versus predicted C2F6 flow. Interpret this plot.
- (d) Does the normality assumption seem reasonable in this problem?
TABLE 4E.4
Uniformity Data for Exercise 4.35

Want to see the full answer?
Check out a sample textbook solution
Chapter 4 Solutions
Introduction to Statistical Quality Control
Additional Math Textbook Solutions
Statistics: The Art and Science of Learning from Data (4th Edition)
Introductory Statistics (2nd Edition)
Introductory Statistics
An Introduction to Mathematical Statistics and Its Applications (6th Edition)
Probability and Statistics for Engineering and the Sciences
- Laetisaric acid is a compound that holds promise for control of fungus diseases in crop plants. The accompanying data show the results of growing the fungus Pythium (y) in various concentrations of laetisaric acid (x). Laetisaric acid concentration (uG/mL) Fungus growth (mm) 0. 33.3 31.0 29.8 27.8 6. 28.0 6. 29.0 10 25.5 10 23.8 20 18.3 20 15.5 30 11.7 30 10.0 Mean 11.500 23.642 Standard deviation 10.884 7.8471 T =-0.98754 %3D a. State the linear regression equation, and with a 0.01 level of significance, predict the amount (in mm) of fungus growth when 25 uG/mL laetisaric acid is applied. Assume the pairs of data follow a bivariate normal distribution and that the scatterplot shows no evidence of a non-linear relationship in the data. b. Determine the percentage of the variation in fungus growth that is explained by the linear relationship between laetisaric acid concentration and fungus growth. Attack Eilarrow_forwardDetermine the critical r values and if the correlation is significantarrow_forwardb) Civil engineers have developed a 3D model to predict the response of jointed concrete pavements to temperature variations. To check this model, they measured the change in traverse strain on six different occasions and compared this to the modelled values. The table below was obtained. Date Jul 25 Aug 4 Aug 16 - p-value, -58 69 35 Sep 3 -32 Oct 26 -40 Nov 3 -83 - conclusion, Percent Use the Summary output below to answer the following question Summary Output 4.4 (iii) Test whether the differences between the measurements are normally distributed. State your: - hypothesis, Ho Data are normally distributed HA Data are not normally distributed : - the test statistic, 99 - Decision (Reject, Retain), 95 90 80 70 60 50 40 30 20 Change in Strain Note for conclusion: -(if you think there is significant evidence data is normally distributed, enter 1) -(if you think there is significant evidence data is not normally distributed, enter O), Summary Output 4.4: 10 Field Measurement 5 1 -40…arrow_forward
- 2. To investigate the effect of pH and catalyst concentration on product viscosity (sSt). Two levels of pH were used 5.6 and 5.9 and two catalyst concentration 2.5 and 2.7. Four products were tested with each combination of pH and catalyst. a. Use the estimate table below to test for main effects and interaction using a = 0.05. What are your conclusions? Predictor Constant Coefficient SDCoeff 191.563 165.49 pH 2.937 1.158 2.52 Catalyst -0.062 1.158 -0.05 pH*Catalyst 5.812 1.158 5.02 b. What is the value for the overall average viscosity? c. Write the regression model for this experiment. d. Below the interaction plot for the experiment. Discuss the information provided by the plot. To maximize viscosity what would be the recommended setting? Interaction Plot for Viscosity Data Mears 200 195 190- 185 Catalyst Concentration Mean Product Viscosity (cSt)arrow_forwardA normal quantile plot of the residuals from this regression model should look like 1. Randomly scattered noise (watermelon seeds) 2. A normal distribution 3. A parabola 4. A uniform distribution 5. A line 6. Symmetricarrow_forwardCalculate the forecasted values of tempurature based on weeks using Moving Average with m = 3. Required: Complete the rest of the table: Week Tempurature Predicted |e| e^2 1 10 - - - 2 14 - - - 3 8 - - - 4 25 29 5 16 6 22 7 14 8 35 9 15 10 27 11 18 12 40 13 28 14 40 15 25 16 65 Calculate the MAE: Calculate the MSE: In which week was forecasted tempurature the furthest from the actual tempurature? Predict what the tempurate would be for Week 17arrow_forward
- Please use the accompanying Excel data set or accompanying Text file data set when completing the following exercise. An article in Wood Science and Technology, "Creep in Chipboard, Part 3: Initial Assessment of the Influence of Moisture Content and Level of Stressing on Rate of Creep and Time to Failure" (1981, Vol. 15, pp. 125-144) studied the deflection (mm) of particleboard from stress levels of relative humidity. Assume that the two variables are related according to the simple linear regression model. The data are shown below x = Stress level (%) 54 54 61 61 68 68 75 75 75 y = Deflection (mm) 16.473 18.693 14.305 15.121 13.505 11.64 11.168 12.534 11.224 a. Calculate the least square estimates of the intercept (a) and slope (b). What is the estimate of o (c)? b. Find the estimate of the mean deflection if the stress level can be limited to 61% (d). c. Estimate the change in the mean deflection associated with a 7% increment in stress level (e). (a) i (Round your answer to 2…arrow_forwardPlease use the accompanying Excel data set or accompanying Text file data set when completing the following exercise. An article in Wood Science and Technology, "Creep in Chipboard, Part 3: Initial Assessment of the Influence of Moisture Content and Level of Stressing on Rate of Creep and Time to Failure" (1981, Vol. 15, pp. 125-144) studied the deflection (mm) of particleboard from stress levels of relative humidity. Assume that the two variables are related according to the simple linear regression model. The data are shown below x = Stress level (%) 54 54 61 61 68 68 75 75 75 y = Deflection (mm) 16.473 18.693 14.305 15.121 13.505 11.64 11.168 12.534 11.224 a. Calculate the least square estimates of the intercept (a) and slope (b). What is the estimate of o² (c)? b. Find the estimate of the mean deflection if the stress level can be limited to 66% (d). c. Estimate the change in the mean deflection associated with a 8% increment in stress level (e). (a) i (Round your answer to 2…arrow_forward5.Data were collected from 175 pharmaceutical companies. Monthly profit (in 10 M$) was regressed on production cost, number of workers, and the location of the company (0: rural, 1: urban). The analysis results are given below. Regress profit location cost workers Source | SS df MS Number of obs = 175 F( 3, 171) 323 Model | 14142.4781 Residual | 2495.7314 11 3 4714.15937 Prob > F 0.0000 R-squared Adj R-squared 14.5949206 0.8503 0.8489 Total | 16638.2095 174 95.6218937 Root MSE 3.3422 Profit| Сof. Std. Err. P>|t| [95% Conf. Interval] Location | -2.326 Cost | -2.753 Workers .07714 _cons 52.701 .7901811 -4.78 0.000 -1.7033 -3.084 .6977087 6.42 0.000 -1.7549 -4.1916 .0086406 3.78 0.000 .04476 .110660 2.923818 15.43 0.000 48.6362 56.7942 Write a short report based on the above results.arrow_forward
- Acrylamide is a chemical that is sometimes found in cooked starchy foods and which is thought to increase the risk of certain kinds of cancer. The paper "A Statistical Regression Model for the Estimation of Acrylamide Concentrations in French Fries for Excess Lifetime Cancer Risk Assessment"t describes a study to investigate the effect of x = y = acrylamide concentration (in micrograms per kg) in French fries. The data in the accompanying table are approximate values read from a graph that appeared in the paper. frying time (in seconds) and %3D Frying Time Acrylamide Concentration 150 155 240 115 240 190 270 180 300 140 300 265arrow_forward"Durable press" cotton fabrics are treated to improve their recovery from wrinkles after washing. "Wrinkle recovery angle" measures how well a fabric recovers from wrinkles. Higher is better. Here are data on the wrinkle recovery angle (in degrees) for two types of treated fabrics: Permafresh 15 12 16 13 11 14 10 Hylite 16 20 18 15 19 A manufacturer wants to know how large is the difference in mean wrinkle recovery angle. Give a 90% confidence interval for the difference in mean wrinkle recovery angle: [three decimal accuracy] [three decimal accuracy]arrow_forwardUse a smoothing constant ALPHA = 0.8 and calculate the forecasted value and smoothing valuearrow_forward
 Glencoe Algebra 1, Student Edition, 9780079039897...AlgebraISBN:9780079039897Author:CarterPublisher:McGraw Hill
