
Introduction to Statistical Quality Control
7th Edition
ISBN: 9781118146811
Author: Montgomery, Douglas C.
Publisher: John Wiley & Sons Inc
expand_more
expand_more
format_list_bulleted
Concept explainers
Videos
Textbook Question
Chapter 4, Problem 58E
Consider the Minitab output shown below.
- (a) Fill in the missing values.
- (b) Can the null hypothesis be rejected at the 0.05 level? Why?
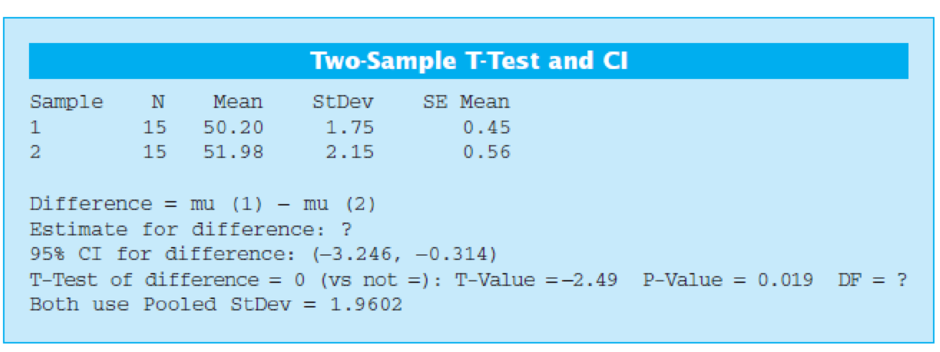
- (c) Use the output and the t-table to find a 99% CI on the difference in means.
- (d) Suppose that the alternative hypothesis was H1: μ1 = μ2 versus H1: μ1 > μ2. What is the P-value? What conclusions would you draw?
Expert Solution & Answer
Want to see the full answer?
Check out a sample textbook solution
Students have asked these similar questions
One particular professional association of investors conducts a weekly survey of its members to measure the percent who are bullish, bearish, and neutral on the stock market for the next six months. The survey results showed 38.1%
bullish, 22.2% neutral, and 39.7% bearish. Assume these results are based on a sample of 300 members.
(a) Over the long term, the proportion of bullish members is 0.39. Conduct a hypothesis test at the 5% level of significance to see if the current sample results show that bullish sentiment differs from its long term average of 0.39. What
are your findings?
Formulate the hypotheses that can be used to determine whether the bullish sentiment differs from its long term average of 0.39.
Ho: p > 0.39
H3: ps 0.39
Ho: p = 0.39
H:p + 0.39
Ho:p 0.39
Find the value of the test statistic. (Round your answer to two decimal places.)
Find the p-value. (Round your answer to four decimal places.)
p-value =
What is your conclusion?
O Do not reject Ho. There is insufficient…
In a test of H0: p = 0.8 against H1: p ≠ 0.8, a sample of size 1000 produces Z = 2.05 for the value of the test statistic. Thus the p-value (or observed level of significance) of the test is approximately equal to:
The difference in the observed neurological disease rate, xbar, for a sample of veterans who served in Iraq is not “statistically significantly different” (alpha = .05), from the overall population disease rate for all U.S. veterans, mu0. This means:
a. xbar = mu0b. The disease rates xbar and mu0 are not equal, but the size of the difference is not practically important, not big enough to matter.
c. H0: mu for Iraq vets = mu0 was not rejected
d. None of the above
Chapter 4 Solutions
Introduction to Statistical Quality Control
Ch. 4 - Suppose that you are testing the following...Ch. 4 - Suppose that you are testing the following...Ch. 4 - Suppose that you are testing the following...Ch. 4 - Suppose that you are testing the following...Ch. 4 - Suppose that you are testing the following...Ch. 4 - Suppose that you are testing the following...Ch. 4 - The inside diameters of bearings used in an...Ch. 4 - The tensile strength of a fiber used in...Ch. 4 - The service life of a battery used in a cardiac...Ch. 4 - Using the data from Exercise 4.7, construct a 95%...
Ch. 4 - A new process has been developed for applying...Ch. 4 - A machine is used to fill containers with a liquid...Ch. 4 - Ferric chloride is used as a flux in some types of...Ch. 4 - The diameters of aluminum alloy rods produced on...Ch. 4 - The output voltage of a power supply is assumed to...Ch. 4 - Two machines are used for filling glass bottles...Ch. 4 - Two quality control technicians measured the...Ch. 4 - Suppose that x1N(,12) and x2N(2,22), and that x1...Ch. 4 - Two different hardening processes(1) saltwater...Ch. 4 - A random sample of 200 printed circuit boards...Ch. 4 - A random sample of 500 connecting rod pins...Ch. 4 - Two processes are used to produce forgings used in...Ch. 4 - A new purification unit is installed in a chemical...Ch. 4 - Two different types of glass bottles are suitable...Ch. 4 - The diameter of a metal rod is measured by 12...Ch. 4 - The cooling system in a nuclear submarine consists...Ch. 4 - An experiment was conducted to investigate the...Ch. 4 - Suppose we wish to test the hypotheses H0:=15H1:15...Ch. 4 - Consider the hypotheses H0:=0H1:0 where 2 is...Ch. 4 - Sample size allocation. Suppose we are testing the...Ch. 4 - Develop a test for the hypotheses H0: 1 = 2 H1: 1 ...Ch. 4 - Nonconformities occur in glass bottles according...Ch. 4 - An inspector counts the surface-finish defects in...Ch. 4 - An in-line tester is used to evaluate the...Ch. 4 - An article in Solid State Technology (May 1987)...Ch. 4 - Compare the mean etch uniformity values at each of...Ch. 4 - An article in the ACI Materials Journal (Vol. 84,...Ch. 4 - Compare the mean compressive strength at each...Ch. 4 - An aluminum producer manufactures carbon anodes...Ch. 4 - Plot the residuals from Exercise 4.36 against the...Ch. 4 - An article in Environmental International (Vol....Ch. 4 - An article in the Journal of the Electrochemical...Ch. 4 - The tensile strength of a paper product is related...Ch. 4 - A plant distills liquid air to produce oxygen,...Ch. 4 - Plot the residuals from Exercise 4.43 and comment...Ch. 4 - Plot the residuals from Exercise 4.44 and comment...Ch. 4 - The brake horsepower developed by an automobile...Ch. 4 - Analyze the residuals from the regression model in...Ch. 4 - Table 4E.11 contains the data from a patient...Ch. 4 - Analyze the residuals from the regression model on...Ch. 4 - Reconsider the patient satisfaction data in Table...Ch. 4 - Analyze the residuals from the multiple regression...Ch. 4 - Consider the Minitab output below. (a) Fill in the...Ch. 4 - Suppose that you are testing H0: 1 = 2 versus H1: ...Ch. 4 - Suppose that you are testing H0: = 2 versus H1: ...Ch. 4 - Consider the Minitab output below. (a) Fill in the...Ch. 4 - Consider the Minitab output shown below. (a) Is...Ch. 4 - Consider the Minitab output shown below. (a) Fill...Ch. 4 - Consider the Minitab output below. (a) Fill in the...Ch. 4 - Consider a one-way or single-factor ANOVA with...Ch. 4 - Consider the Minitab ANOVA output below. Fill in...
Additional Math Textbook Solutions
Find more solutions based on key concepts
In Exercises 1–3, refer to the accompanying screen display that results from the Verizon airport data speeds (M...
Essentials of Statistics (6th Edition)
Alvie Singer lives at 0 in the accompanying diagram and has four friends who live at A, B, C, and D. One day Al...
Probability and Statistics for Engineering and the Sciences
z Scores. In Exercises 5-8, express all z scores with two decimal places.
8. Plastic Waste Data Set 31 “Garbage...
Elementary Statistics Using Excel (6th Edition)
To find the median winning speed.
Stats: Modeling the World Nasta Edition Grades 9-12
An investment analyst has tracked a certain blue-chip stock for the past six months and found that on any given...
An Introduction to Mathematical Statistics and Its Applications (6th Edition)
Knowledge Booster


Learn more about
Need a deep-dive on the concept behind this application? Look no further. Learn more about this topic, statistics and related others by exploring similar questions and additional content below.Similar questions
- Q2C. Considering the following MA(3) process: Yt=ut 0.7ut-1 - 0.2ut-2 +0.4ut-3 Where ut is a white noise process with variance equal to 1. What is the value Yk = cov(yt, Yt-k) for k = 0? Provide the correct answer along with the working steps and underlying assumptions used to calculate the value of yk = cov(yt, Yt-k) for k = 0. i. Yo = 1.69 ii. Yo = 0.63 iii. Yo = 1 iv. Yo = 0arrow_forwardAn investigator is interested if there is a difference in the time (in seconds) to sprint a given distance among non-smokers, past smokers and current smokers. He obtained the following data: 1. State your hypotheses. 2. What is the appropriate statistical test to determine if there is a difference in the sprint times among different smoking groups? 3. The investigator uses α = 0.01 as the level of significance (df = 2, 350). Give the critical value and region of rejection. 4. Should the null hypothesis be rejected? 5. State your conclusion. 6. Given your conclusion, what is the next procedure that should be done? 7. If the investigator classified the smoking groups according to their gender and obtained the mean sprint times per gender for each group, what type of statistical test should be used now?arrow_forwardTrue or false: If P = 0.08, then a. The result is statistically significant at the α = 0.05 level.arrow_forward
- According to shopper data, 97% of households purchase toilet paper. An analyst believes this is too low. To investigate, the analyst selects a random sample of 500 households and finds that 98% of them purchase toilet paper. Do these data provide convincing statistical evidence at the α = 0.05 level to conclude that the true proportion of all households that purchase toilet paper differs from 0.97? Complete the “State” step for this test. H0: p = Ha: p where p = the true proportion of all that .arrow_forwardYou are testing the null hypothesis that there is no relationship between two variables, X and Y. From your sample of n=22, you determine that SSR=60 and SSE=20. Find the test statistic, tSTAT. (Round to four decimal places as needed.)arrow_forward2. We performed a linear regression using 25 observations. From the regression output we find that bo = 5.7, bị = 12.9, x = 11.4, Sz = 3.2 and MSE = 12.25. a. From the least squares line, what is the predicted response when x* = 10.65? y = b. What is the 95% confidence interval for the mean response when x* = 10.65? c. What is the 95% prediction interval for an individual response when x* = 10.65? d. Which interval is wider? The confidence interval or the prediction interval? O a. Confidence Interval b. Prediction Intervalarrow_forward
- A car magazine claims that there is a linear relationship between a car’s weight, in pounds, and the car’s fuel efficiency, in miles per gallon. The magazine collected data and used the data to test the claim at a significance level of α=0.05. The magazine tested the following hypotheses. H0:β1=0 Ha:β1≠0 The test yielded a t-value of 1.95 and a p-value of 0.08. Which of the following is a correct conclusion about the magazine’s claim?arrow_forward#6.3 (p.344). Conduct a test of H0: μ1>= μ2-2.3 versus Ha: μ1< μ2-2.3 for the sample data summarized here. Use α=0.01 in reaching your conclusions.arrow_forward58% of students entering four-year colleges receive a degree within six years. Is this percent smaller than for students who play intramural sports? 121 of the 228 students who played intramural sports received a degree within six years. What can be concluded at the level of significance of αα = 0.01? For this study, we should use Select an answer t-test for a population mean or z-test for a population proportion The null and alternative hypotheses would be: Ho: ? p or μ is = > < ≠ ____ (please enter a decimal) H1: μ or p is > = ≠ < ____ (Please enter a decimal) The test statistic t or z = ___ (please show your answer to 3 decimal places.) The p-value = ___ (Please show your answer to 4 decimal places.) The p-value is ≤ > to α Based on this, we should Select an answer- fail to reject, accept, or reject the null hypothesis. Thus, the final conclusion is that ... The data suggest the population proportion is not significantly smaller than 58% at αα = 0.01,…arrow_forward
- The number of points held by a sample of the NHL's highest scores for both the eastern conference and the western conference is shown below. At alpha = 0.05 , can it be concluded that there is difference in means based on these data? look at the picture for the data!arrow_forwardAlso, using α = .05, run a two-tail t-test for one sample to test Ho: µ=283 for the 2009 scores. Report the t-obt, df, and p-values. Would you reject the null hypothesis that the 2009 scores come from a population with average 283? If this is the case, does it come from a population from larger or smaller average?arrow_forwardAccording to the American Pet Products Manufacturers Association, cat owners spend an average of $179 annually in routine veterinary visits. A random sample of local cat owners revealed that ten randomly selected owners spent an average of $205 with s = $26. Is there a significant statistical difference at α = 0.01?The test statics isarrow_forward
arrow_back_ios
SEE MORE QUESTIONS
arrow_forward_ios
Recommended textbooks for you
 Calculus For The Life SciencesCalculusISBN:9780321964038Author:GREENWELL, Raymond N., RITCHEY, Nathan P., Lial, Margaret L.Publisher:Pearson Addison Wesley,
 Glencoe Algebra 1, Student Edition, 9780079039897...AlgebraISBN:9780079039897Author:CarterPublisher:McGraw Hill
Calculus For The Life Sciences
Calculus
ISBN:9780321964038
Author:GREENWELL, Raymond N., RITCHEY, Nathan P., Lial, Margaret L.
Publisher:Pearson Addison Wesley,
Glencoe Algebra 1, Student Edition, 9780079039897...
Algebra
ISBN:9780079039897
Author:Carter
Publisher:McGraw Hill
Hypothesis Testing - Solving Problems With Proportions; Author: The Organic Chemistry Tutor;https://www.youtube.com/watch?v=76VruarGn2Q;License: Standard YouTube License, CC-BY
Hypothesis Testing and Confidence Intervals (FRM Part 1 – Book 2 – Chapter 5); Author: Analystprep;https://www.youtube.com/watch?v=vth3yZIUlGQ;License: Standard YouTube License, CC-BY