
Concept explainers
Videos
An article in the ACI Materials Journal (Vol. 84, 1987, pp. 213–216) describes several experiments investigating the rodding of concrete to remove entrapped air. A 3-in.-diameter cylinder was used, and the number of times this rod was used is the design variable. The resulting compressive strength of the concrete specimen is the response. The data are shown in Table 4E.5.
TABLE 4E.5
Compressive Strength Data for Exercise 4.37
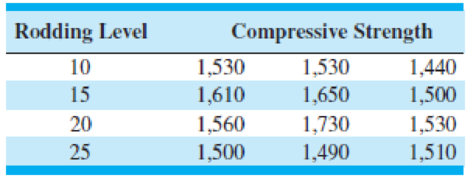
- (a) Is there any difference in compressive strength due to the rodding level? Answer this question by using the analysis of variance with α = 0.05.
- (b) Construct box plots of compressive strength by rodding level. Provide a practical interpretation of these plots.
- (c) Construct a normal
probability plot of the residuals from this experiment. Does the assumption of anormal distribution for compressive strength seem reasonable?
Want to see the full answer?
Check out a sample textbook solution
Chapter 4 Solutions
Introduction to Statistical Quality Control
Additional Math Textbook Solutions
Business Statistics: A First Course (7th Edition)
Basic Business Statistics, Student Value Edition (13th Edition)
Statistical Reasoning for Everyday Life (5th Edition)
Elementary Statistics: Picturing the World (7th Edition)
Introductory Statistics
Statistics for Business & Economics, Revised (MindTap Course List)


- A stamped sheet steel plate is shown in Figure 164. Compute dimensions AF to 3 decimal places. All dimensions are in inches. A=_B=_C=_D=_E=_F=_arrow_forwardAn article in the ACI Materials Journal (Vol. 84, 1987, pp. 213-216) describes several experiments investigating the rodding of concrete to remove trapped air. A 3-inch x 6-inch cylinder was used, and the number of times this rod was used is the design variable. The resulting compressive strength of the concrete specimen is the response. The data are shown in the following table. Compressive Strength (psi) Observations Rodding Level 10 15 20 25 1530 1530 1440 1610 1650 1500 1560 1730 1530 1500 1490 1510 (a) Is there any difference in compressive strength due to the rodding level? Use a = 0.05. Calculate to 2 decimal places for Is there statistical evidence to say that rodding level affects compressive strength? (b) Find to 2 decimal places the P-value for the F-statistic computed in part (a). P-value= (c) Analyze the following residual plots to determine model adequacy, Does the assumption of normality seem reasonable? Does there appear to be an outlier in the data? Does the assumption…arrow_forwardAn experiment was conducted to study the extrusion process of biodegradable packaging foam. Two of the factors considered for their effect on the unit density (mg/ml) were the die temperature (145 °C vs. 155 °C) and the die diameter (3 mm vs. 4 mm). The results are stored in [Packaging Foam 1]. Source: Data extracted from W. Y. Koh, K. M. Eskridge, and M. A. Hanna, "Supersaturated Split-Plot Designs," Journal of Quality Technology, 45, January 2013, pp. 61-72.At the 0.05 level of significance, 3mm 4mm 57.22 145 72.54 145 53.60 66.70 145 48.13 49.28 145 69.89 44.14 145 62.78 58.37 145 55.18 53.98 155 57.50 63.03 155 54.17 46.73 155 73.86 60.17 155 90.28 46.78 155 88.19 43.27 155 82.61 56.93 Die Temperature a. is there an interaction between die temperature and die diameter? b. is there an effect due to die temperature? c. is there an effect due to die diameter? d. Plot the mean unit density for each die temperature for each die diameter. e. What can you conclude about the effect of die…arrow_forward
- Wild irises are beautiful flowers found throughout the United States, Canada, and northern Europe. This problem concerns the length of the sepal (leaf-like part covering the flower) of different species of wild iris. Data are based on information taken from an article by R. A. Fisher in Annals of Eugenics (Vol. 7, part 2, pp. 179 -188). Measurements of sepal length in centimeters from random samples of Iris setosa (I), Iris versicolor (II), and Iris virginica (III) are as follows below. I II III 5.5 5.2 6.8 4.6 6.5 5.3 5.1 6.1 4.4 5.5 4.1 7.9 4.1 5.1 5.9 5.4 6.1 6.9 5.4 5.1 6.6 Shall we reject or not reject the claim that there are no differences among the population means of sepal length for the different species of iris? Use a 5% level of significance. (a) What is the level of significance?State the null and alternate hypotheses. Ho: ?1 = ?2 = ?3; H1: Exactly two means are equal.Ho: ?1 = ?2 = ?3; H1: Not all the means are equal. Ho: ?1 = ?2 = ?3; H1:…arrow_forwardPepsi Cans. In Exercises 5-8, refer to the axial loads (pounds) of aluminum Pepsi cans that are 0.0109 in. thick, as listed in Data Set 30 “Aluminum Cans” in Appendix B. An axial load of a can is the maximum weight supported by the side, and it is important to have an axial load high enough so that the can isn’t crushed when the top lid is pressed onto the top. There are seven measurements from each of 25 days of production. If the 175 axial loads are in one column, the first 7 are from the first day, the next 7 are from the second day, and so on, so that the “subgroup size” is 7. Pepsi Cans: R Chart Treat the seven measurements from each day as a sample and construct an R chart. What does the result suggest?arrow_forwardWild irises are beautiful flowers found throughout the United States, Canada, and northern Europe. This problem concerns the length of the sepal (leaf-like part covering the flower) of different species of wild iris. Data are based on information taken from an article by R. A. Fisher in Annals of Eugenics (Vol. 7, part 2, pp. 179 -188). Measurements of sepal length in centimeters from random samples of Iris setosa (I), Iris versicolor (II), and Iris virginica (III) are as follows below. I II III 5.9 5.8 6.9 4.8 6.5 5.6 4.6 6.4 4.9 5.7 4.3 7.7 4.8 5.8 5.6 5.4 6.3 6.3 5.8 5.5 6.6 Shall we reject or not reject the claim that there are no differences among the population means of sepal length for the different species of iris? Use a 5% level of significance. (b) Find SSTOT, SSBET, and SSW and check that SSTOT = SSBET + SSW. (Use 3 decimal places.) SSTOT = SSBET = SSW = Find d.f.BET, d.f.W, MSBET, and MSW. (Use 4 decimal places for MSBET, and…arrow_forward
- Wild irises are beautiful flowers found throughout the United States, Canada, and northern Europe. This problem concerns the length of the sepal (leaf-like part covering the flower) of different species of wild iris. Data are based on information taken from an article by R. A. Fisher in Annals of Eugenics (Vol. 7, part 2, pp. 179 -188). Measurements of sepal length in centimeters from random samples of Iris setosa (I), Iris versicolor (II), and Iris virginica (III) are as follows below. I II III 5.7 5.1 6.5 4.7 6.2 5.1 4.7 6.6 4.7 5.8 4.9 7.5 4.6 5.2 5.3 5.3 6.2 6.2 5.4 5.8 6.4 (b) Find SSTOT, SSBET, and SSW and check that SSTOT = SSBET + SSW. (Use 3 decimal places.) SSTOT = SSBET = SSW = Find d.f.BET, d.f.W, MSBET, and MSW. (Use 4 decimal places for MSBET, and MSW.) dfBET = dfW = MSBET = MSW = Find the value of the sample F statistic. (Use 2 decimal places.)What are the degrees of freedom? (numerator) (denominator)arrow_forwardWild irises are beautiful flowers found throughout the United States, Canada, and northern Europe. This problem concerns the length of the sepal (leaf-like part covering the flower) of different species of wild iris. Data are based on information taken from an article by R. A. Fisher in Annals of Eugenics (Vol. 7, part 2, pp. 179 -188). Measurements of sepal length in centimeters from random samples of Iris setosa (I), Iris versicolor (II), and Iris virginica (III) are as follows below. I II III 5.6 5.5 6.9 4.5 6.6 5.5 5.4 6.5 4.3 5.4 4.6 7.9 4.7 5.6 5.8 5.9 6.6 6.3 5.6 5.6 6.9 Shall we reject or not reject the claim that there are no differences among the population means of sepal length for the different species of iris? (b) Find SSTOT, SSBET, and SSW and check that SSTOT = SSBET + SSW. (Use 3 decimal places.) SSTOT = SSBET = SSW = Find d.f.BET, d.f.W, MSBET, and MSW. (Use 4 decimal places for MSBET, and MSW.) dfBET = dfW =…arrow_forwardWild irises are beautiful flowers found throughout the United States, Canada, and northern Europe. This problem concerns the length of the sepal (leaf-like part covering the flower) of different species of wild iris. Data are based on information taken from an article by R. A. Fisher in Annals of Eugenics (Vol. 7, part 2, pp. 179 -188). Measurements of sepal length in centimeters from random samples of Iris setosa (I), Iris versicolor (II), and Iris virginica (III) are as follows below. I II III 5.9 5.5 6.7 4.1 6.8 5.8 5.2 6.5 4.5 5.4 4.5 7.2 4.1 5.4 5.2 5.2 6.2 6.9 5.6 5.2 6.7 Shall we reject or not reject the claim that there are no differences among the population means of sepal length for the different species of iris? Use a 10% level of significance. (a) What is the level of significance? 0.01 State the null and alternate hypotheses. O H,: H1 = H, = Hzi H;: All three means are different. O H,: H1 = H2 = Hzi H;: Exactly two means are equal. O H,: H, = H2 = Hai H,: At least two…arrow_forward
- Wild irises are beautiful flowers found throughout the United States, Canada, and northern Europe. This problem concerns the length of the sepal (leaf-like part covering the flower) of different species of wild iris. Data are based on information taken from an article by R. A. Fisher in Annals of Eugenics (Vol. 7, part 2, pp. 179 -188). Measurements of sepal length in centimeters from random samples of Iris setosa (I), Iris versicolor (II), and Iris virginica (III) are as follows below. I II III 5.5 5.2 6.7 4.4 6.5 5.7 5.2 6.9 4.1 5.9 4.4 7.8 4.3 5.5 5.7 5.3 6.4 6.1 5.8 5.5 6.9 Shall we reject or not reject the claim that there are no differences among the population means of sepal length for the different species of iris? Use a 10% level of significance. (a) What is the level of significance? (b) Find SSTOT, SSBET, and SSW and check that SSTOT = SSBET + SSW. (Use 3 decimal places.) SSTOT = ? SSBET = ? SSW = ? Find d.f.BET, d.f.W, MSBET, and…arrow_forwardAn article in the Fire Safety Journal (“The Effect of Nozzle Design on the Stability and Performance of Turbulent Water Jets,” Vol. 4, August 1981) describes an experiment in which a shape factor was determined for several different nozzle designs at six levels of jet efflux velocity. Interest focused on potential differences between nozzle designs (blocks), with velocity considered as a nuisance variable. The data are shown below: Jet Efflux Velocity (m/s) Nozzle Design 11.73 14.37 16.59 20.43 23.46 28.74 1 0.78 0.80 0.81 0.75 0.77 0.78 2 0.85 0.85 0.92 0.86 0.81 0.83 3 0.93 0.92 0.95 0.89 0.89 0.83 4 1.14 0.97 0.98 0.88 0.86 0.83 5 0.97 0.86 0.78 0.76 0.76 0.75 1) Write the null hypothesis and the alternative hypothesis (for the factor). 2) Find the ANOVA table. (round to five decimal places). 3) What is your decision about the null hypothesis, consider ?. 4) If your decision in part (4) was reject , perform Tukey test to determine which pairwise means are…arrow_forward5. The compressive strength of concrete (in kg/m) is being tested b y two civil engineers. The first engineer tests ten specimens and obtains the following data: 2000 2100 2050 2150 2200 2050 2000 2100 2250 2000 While the following data is obtained by the second engineer who tests eight specimens: 2000 2200 2050 2150 2250 2100 2250 2150 The compressive strength of concrete is assumed to be normally distributed. Construct a 90% confidence interval for the ratio of standard deviation of compressive strength of all concretes.[(0.505,1.757) [ref:T2S20708] 6. A new teaching method to improve the failing rate if English SPM papers is being considered. The existing and new teaching method were applied to samples of students so as to determine whether the new teaching method improves the proportion of students who failed in their English papers. 1425 of 1500 students who were taught based on the existing teaching method and 1920 of 2000 students who were taught based on the new teaching method…arrow_forward
 Calculus For The Life SciencesCalculusISBN:9780321964038Author:GREENWELL, Raymond N., RITCHEY, Nathan P., Lial, Margaret L.Publisher:Pearson Addison Wesley,
 Algebra & Trigonometry with Analytic GeometryAlgebraISBN:9781133382119Author:SwokowskiPublisher:Cengage
 Mathematics For Machine TechnologyAdvanced MathISBN:9781337798310Author:Peterson, John.Publisher:Cengage Learning,
 Glencoe Algebra 1, Student Edition, 9780079039897...AlgebraISBN:9780079039897Author:CarterPublisher:McGraw Hill