
Introduction to Statistical Quality Control
7th Edition
ISBN: 9781118146811
Author: Montgomery, Douglas C.
Publisher: John Wiley & Sons Inc
expand_more
expand_more
format_list_bulleted
Videos
Textbook Question
Chapter 4, Problem 35E
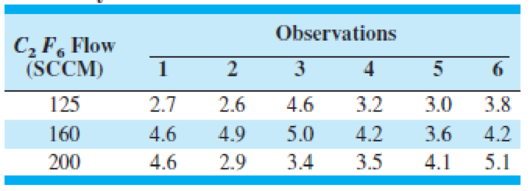
An article in Solid State Technology (May 1987) describes an experiment to determine the effect of C2F6 flow rate on etch uniformity on a silicon wafer used in integrated-circuit manufacturing. Three flow rates are tested, and the resulting uniformity (in percent) is observed for six test units at each flow rate. The data are shown in Table 4E.4.
- (a) Does C2F6 flow rate affect etch uniformity? Answer this question by using an analysis of variance with α = 0.05.
- (b) Construct a box plot of the etch uniformity data. Use this plot, together with the analysis of variance results, to determine which gas flow rate would be best in terms of etch uniformity (a small percentage is best).
- (c) Plot the residuals versus predicted C2F6 flow. Interpret this plot.
- (d) Does the normality assumption seem reasonable in this problem?
TABLE 4E.4
Uniformity Data for Exercise 4.35
Expert Solution & Answer
Want to see the full answer?
Check out a sample textbook solution
Students have asked these similar questions
The output of a solar panel (photovoltaic) system depends on its size. A manufacturer states that the average daily production of its 1.5 kW system is 6.6 kilowatt hours (kWh) for Perth conditions. A consumer group monitored this 1.5 kW system in 20 different Perth homes and measured the average daily production by the systems in these homes over a one month period during October. The data is provided here.
kWh 6.2, 5.8, 5.9, 6.1, 6.4, 6.3, 6.9, 5.5, 7.4, 6.7, 6.3, 6.2, 7.1, 6.8, 5.9, 5.4, 7.2, 6.7, 5.8, 6.9
1. Analyse the consumer group’s data to test if the manufacturer’s claim of an average of 6.6 kWh per day is reasonable. State appropriate hypotheses, assumptions and decision rule at α = 0.10. What conclusions would you report to the consumer group? (Hint: You will need to find Descriptive Statistics first.)
2. If 48 homes in the central Australian city of Alice Springs had this system installed and similar data was collected, in order to assess whether average daily production in…
Cellulon, a manufacturer of home insulation, wants to develop guidelines for builders and consumers on how the thickness of the insulation in the attic of a home and the outdoor temperature affect natural gas consumption. In the laboratory, it varied the insulation thickness and temperature. A few of the findings are:
An article in the ASCE Journal of Energy Engineering [“Overview of Reservoir Release Improvements at 20 TVA Dams” (Vol. 125, April 1999, pp. 1–17)] presents data on dissolved oxygen concentrations in streams below 20 dams in the Tennessee Valley Authority system. The observations are (in milligrams per liter):
Chapter 4 Solutions
Introduction to Statistical Quality Control
Ch. 4 - Suppose that you are testing the following...Ch. 4 - Suppose that you are testing the following...Ch. 4 - Suppose that you are testing the following...Ch. 4 - Suppose that you are testing the following...Ch. 4 - Suppose that you are testing the following...Ch. 4 - Suppose that you are testing the following...Ch. 4 - The inside diameters of bearings used in an...Ch. 4 - The tensile strength of a fiber used in...Ch. 4 - The service life of a battery used in a cardiac...Ch. 4 - Using the data from Exercise 4.7, construct a 95%...
Ch. 4 - A new process has been developed for applying...Ch. 4 - A machine is used to fill containers with a liquid...Ch. 4 - Ferric chloride is used as a flux in some types of...Ch. 4 - The diameters of aluminum alloy rods produced on...Ch. 4 - The output voltage of a power supply is assumed to...Ch. 4 - Two machines are used for filling glass bottles...Ch. 4 - Two quality control technicians measured the...Ch. 4 - Suppose that x1N(,12) and x2N(2,22), and that x1...Ch. 4 - Two different hardening processes(1) saltwater...Ch. 4 - A random sample of 200 printed circuit boards...Ch. 4 - A random sample of 500 connecting rod pins...Ch. 4 - Two processes are used to produce forgings used in...Ch. 4 - A new purification unit is installed in a chemical...Ch. 4 - Two different types of glass bottles are suitable...Ch. 4 - The diameter of a metal rod is measured by 12...Ch. 4 - The cooling system in a nuclear submarine consists...Ch. 4 - An experiment was conducted to investigate the...Ch. 4 - Suppose we wish to test the hypotheses H0:=15H1:15...Ch. 4 - Consider the hypotheses H0:=0H1:0 where 2 is...Ch. 4 - Sample size allocation. Suppose we are testing the...Ch. 4 - Develop a test for the hypotheses H0: 1 = 2 H1: 1 ...Ch. 4 - Nonconformities occur in glass bottles according...Ch. 4 - An inspector counts the surface-finish defects in...Ch. 4 - An in-line tester is used to evaluate the...Ch. 4 - An article in Solid State Technology (May 1987)...Ch. 4 - Compare the mean etch uniformity values at each of...Ch. 4 - An article in the ACI Materials Journal (Vol. 84,...Ch. 4 - Compare the mean compressive strength at each...Ch. 4 - An aluminum producer manufactures carbon anodes...Ch. 4 - Plot the residuals from Exercise 4.36 against the...Ch. 4 - An article in Environmental International (Vol....Ch. 4 - An article in the Journal of the Electrochemical...Ch. 4 - The tensile strength of a paper product is related...Ch. 4 - A plant distills liquid air to produce oxygen,...Ch. 4 - Plot the residuals from Exercise 4.43 and comment...Ch. 4 - Plot the residuals from Exercise 4.44 and comment...Ch. 4 - The brake horsepower developed by an automobile...Ch. 4 - Analyze the residuals from the regression model in...Ch. 4 - Table 4E.11 contains the data from a patient...Ch. 4 - Analyze the residuals from the regression model on...Ch. 4 - Reconsider the patient satisfaction data in Table...Ch. 4 - Analyze the residuals from the multiple regression...Ch. 4 - Consider the Minitab output below. (a) Fill in the...Ch. 4 - Suppose that you are testing H0: 1 = 2 versus H1: ...Ch. 4 - Suppose that you are testing H0: = 2 versus H1: ...Ch. 4 - Consider the Minitab output below. (a) Fill in the...Ch. 4 - Consider the Minitab output shown below. (a) Is...Ch. 4 - Consider the Minitab output shown below. (a) Fill...Ch. 4 - Consider the Minitab output below. (a) Fill in the...Ch. 4 - Consider a one-way or single-factor ANOVA with...Ch. 4 - Consider the Minitab ANOVA output below. Fill in...
Additional Math Textbook Solutions
Find more solutions based on key concepts
Constructing Confidence Intervals In Exercises 35–38, you are given the sample mean and the population standard...
Elementary Statistics: Picturing the World (7th Edition)
A father rates his daughter as a 2 on a 7-point scale (from 1 to 7) of crankiness. In this example, (a) what is...
Statistics for Psychology
In hypothesis testing, the common level of significance is =0.05. Some might argue for a level of significance ...
Basic Business Statistics, Student Value Edition (13th Edition)
True or False? In Exercises 5–8, determine whether the statement is true or false. If it is false, rewrite it a...
Elementary Statistics: Picturing the World (6th Edition)
50. Swimming Recently, a group of adults who swim regularly for exercise were evaluated for depression. It turn...
STATS:DATA+MODELS-W/DVD
In a test of the quality of two television commercials, each commercial was shown in a separate test area six t...
Statistics for Business & Economics, Revised (MindTap Course List)
Knowledge Booster


Learn more about
Need a deep-dive on the concept behind this application? Look no further. Learn more about this topic, statistics and related others by exploring similar questions and additional content below.Similar questions
- Silicon chip manufacturers require the use of so-called "clean rooms" in which the air is filtered in a special way to keep the number of dust particles to a minimum. Five air samples were taken in each room and the dust level was measured on a scale of 1 (low) to 10 (high). Room 1 Room 2 Room 3 5 3 1 6.5 6 1.5 4 4 3 7 4.5 2.5 6 3 4 a) Do an analysis of variance and interpret the result.b) Based on the above results, if appropriate, use the Tukey-Kramer test to make all pairwise comparisons of clean rooms.arrow_forwardFor steady-state water flow in a circular pipe made of concrete The following data have been collected: PIPE DIAMETER 0.3 EXPERIMENT SLOPE m/s VOLUMETRIC 1 0.001 0.04 2 0,6 0,.001 0,24 0.9 0,001 0,69 4 0.3 0,01 0,13 0.6 0,01 0.82 6. 0,9 0,01 2,38 7 0,3 0.05 0,31 8. 0.6 0.05 1.95 0,9 0.05 5.66 Determine the parameters (a0, a1 and a2) in the equation for the relation between Volumetric flow, Slope and Pipe Diameter using nonLinear Regression analysis Q = a,Dª S°:arrow_forwardAn article in the Fire Safety Journal (“The Effect of Nozzle Design on the Stability and Performance of Turbulent Water Jets,” Vol. 4, August 1981) describes an experiment in which a shape factor was determined for several different nozzle designs at six levels of jet efflux velocity. Interest focused on potential differences between nozzle designs (blocks), with velocity considered as a nuisance variable. The data are shown below: Jet Efflux Velocity (m/s) Nozzle Design 11.73 14.37 16.59 20.43 23.46 28.74 1 0.78 0.80 0.81 0.75 0.77 0.78 2 0.85 0.85 0.92 0.86 0.81 0.83 3 0.93 0.92 0.95 0.89 0.89 0.83 4 1.14 0.97 0.98 0.88 0.86 0.83 5 0.97 0.86 0.78 0.76 0.76 0.75 1) Write the null hypothesis and the alternative hypothesis (for the factor). 2) Find the ANOVA table. (round to five decimal places). 3) What is your decision about the null hypothesis, consider ?. 4) If your decision in part (4) was reject , perform Tukey test to determine which pairwise means are…arrow_forward
- The output of a solar panel (photovoltaic) system depends on its size. A manufacturer states that the average daily production of its 1.5 kW system is 6.6 kilowatt hours (kWh) for Perth conditions. A consumer group monitored this 1.5 kW system in 20 different Perth homes and measured the average daily production by the systems in these homes over a one month period during October. The data is provided here. (a) Analyse the consumer group’s data to test if the manufacturer’s claim of an average of 6.6 kWh per day is reasonable. State appropriate hypotheses, assumptions and decision rule at α = 0.10. What conclusions would you report to the consumer group? Hint: You will need to find Descriptive Statistics first.) (b) If 48 homes in the central Australian city of Alice Springs had this system installed and similar data wascollected, in order to assess whether average daily production in Alice Springs exceeded 6.6 kWh, (i) what would the alternate hypothesis be? (ii) What would be the…arrow_forwardEnvironmental conditions can affect the growth of coral. To study this, a researcher examined a species of coral that is found in the Caribbean Sea and the Gulf of Mexico. At 12 localities, he determined the average annual calcification rate of coral over a period of several years and the average annual maximum sea surface temperature during the same period. Calcification rate affects the growth of coral, with higher rates corresponding to greater growth. The table contains data for these 12 localities. Maximum sea surface temperature (°C) and calcification rate (g cm² yr¯¹) Maximum Sea Surface Temperature 29.4 29.4 29.4 29.6 29.1 28.7 Calcification Rate 1.48 1.53 1.52 1.48 1.31 1.25 Maximum Sea Surface Temperature 29.7 29.5 29.4 29.0 29.0 29.0 Calcification Rate 1.63 1.53 1.46 1.24 1.29 1.12 To access the complete data set, click the link for your preferred software format: Excel Minitab JMP SPSS TI R Mac-TXT PC-TXT CSV CrunchIt! The residuals for average annual maximum sea surface…arrow_forwardIs it possible to get the following from a set of experimental data: (a) r23 = 0.8, r13 = - 0.5, r12 = 0.6 %3D %3D %3D (b) r23 = 0.7, r13 = - 0.4, r12 = 0.6 %3D %3D %3Darrow_forward
- The spotted lanternfly, Lycorma delicatula, is an invasive species to the United States that has the potential to do significant agricultural damage. An ecologist is studying the relationship between the size of the female spotted lanternflies and the number of eggs they produce. The data are summarized below. Length of insect: AVG = 1 inch, SD = 0.15 inchNumber of eggs: AVG = 40 eggs, SD = 5 eggsr = 0.2 Using regression, we can say that the average number of eggs produced by female spotted lanternflies who are 1.1 inch long is closest to... Group of answer choices 42 39 40 41arrow_forwardA sociologist wants to determine if the life expectancy of people in Africa is less than the life expectancy of people in Asia. The data obtained is shown in the table below. Africa Asia = 63.3 yr. 1 X,=65.2 yr. 2 o, = 9.1 yr. = 7.3 yr. n1 = 120 = 150arrow_forwardOne operation of a mill is to cut pieces of steel into parts that will later be used as the frame for front seats in an automobile. The steel is cut with a diamond saw and requires the resulting parts to be within 10.005 inch of the length specified by the automobile company. Data are collected from a sample of 50 steel parts and are shown in the following table. The measurement reported is the difference in inches between the actual length of the steel part, as measured by a laser measurement device, and the specified length of the steel part. For example, the first value, -0.003, represents a steel part that is 0.003 inch shorter than the specified length. Complete parts a through c Click the icon to view the data table. a. Construct a frequency distribution Difference in Length -0.005 but less than -0.003: -0.003but less than -0.001 -0.001but less than 0.001 0.001but less than 0.003 0.003but less than 0.005 Frequency Difference Between Actual and Specified Lengths 0.002 0 -0.003…arrow_forward
- An article in the Journal of Environmental Engineering (1989, Vol. 115(3), pp. 608–619) reported the results of a study on the occurrence of sodium and chloride in surface streams in central Rhode Island. The following data are chloride concentration y (in milligrams per liter) and roadway area in the watershed x (in percentage).arrow_forwardAir pollutants common in U.S. cities include fine particulate matter (PM) and ozone (O3). PM is measured as “inhalable” particles 10 micrometers in diameter or “fine inhalable” particles 2.5 micrometers in diameter. Suppose that studies show, for a particular region, that cities exceed PM2.5 standards 20% of the time and exceed ozone standards 10% of the time. Assume that PM2.5 and ozone measurements are statistically independent. A) Determine the probability that a city, selected at random, exceeds one of the standards. B) If a city exceeds the standards, what is the probability that it exceeds only the PM2.5 standard?arrow_forwardThe DENR has a new procedure to detect algal bloom in water being tested. This new procedure is important because, it could be used to detect three different contaminants-organic pollutants, volatile solvents, and chlorinated compounds. The department claims that it can detect high levels of organic pollutants with 99.95% accuracy, volatile solvents with 99.70% accuracy, and chlorinated compounds with 89.70% accuracy. If an algal bloom is not present, the test does not signal. Samples are prepared for the calibration of the test and 60% of them are contaminated with organic pollutants, 27% with volatile solvents, and 13% with traces of chlorinated compounds. A test sample is selected randomly. Denote as follows: S= signal, 0 = organic pollutants, V = volatile solvents, C = chlorinated compounds. If the test signals, what is the probability that chlorinated compounds are present? (Show complete solution in your answer sheet) O a. P(C|S) = 0.1184 O b. P(C|S) = 0.1386 O c. None among the…arrow_forward
arrow_back_ios
SEE MORE QUESTIONS
arrow_forward_ios
Recommended textbooks for you
 Calculus For The Life SciencesCalculusISBN:9780321964038Author:GREENWELL, Raymond N., RITCHEY, Nathan P., Lial, Margaret L.Publisher:Pearson Addison Wesley,
 Linear Algebra: A Modern IntroductionAlgebraISBN:9781285463247Author:David PoolePublisher:Cengage Learning
 Glencoe Algebra 1, Student Edition, 9780079039897...AlgebraISBN:9780079039897Author:CarterPublisher:McGraw Hill
Calculus For The Life Sciences
Calculus
ISBN:9780321964038
Author:GREENWELL, Raymond N., RITCHEY, Nathan P., Lial, Margaret L.
Publisher:Pearson Addison Wesley,
Linear Algebra: A Modern Introduction
Algebra
ISBN:9781285463247
Author:David Poole
Publisher:Cengage Learning
Glencoe Algebra 1, Student Edition, 9780079039897...
Algebra
ISBN:9780079039897
Author:Carter
Publisher:McGraw Hill
Hypothesis Testing using Confidence Interval Approach; Author: BUM2413 Applied Statistics UMP;https://www.youtube.com/watch?v=Hq1l3e9pLyY;License: Standard YouTube License, CC-BY
Hypothesis Testing - Difference of Two Means - Student's -Distribution & Normal Distribution; Author: The Organic Chemistry Tutor;https://www.youtube.com/watch?v=UcZwyzwWU7o;License: Standard Youtube License