
Introduction to Statistical Quality Control
7th Edition
ISBN: 9781118146811
Author: Montgomery, Douglas C.
Publisher: John Wiley & Sons Inc
expand_more
expand_more
format_list_bulleted
Concept explainers
Videos
Textbook Question
Chapter 4, Problem 52E
Analyze the residuals from the multiple regression model on the patient satisfaction data from Exercise 4.51. Comment on the adequacy of the regression model.
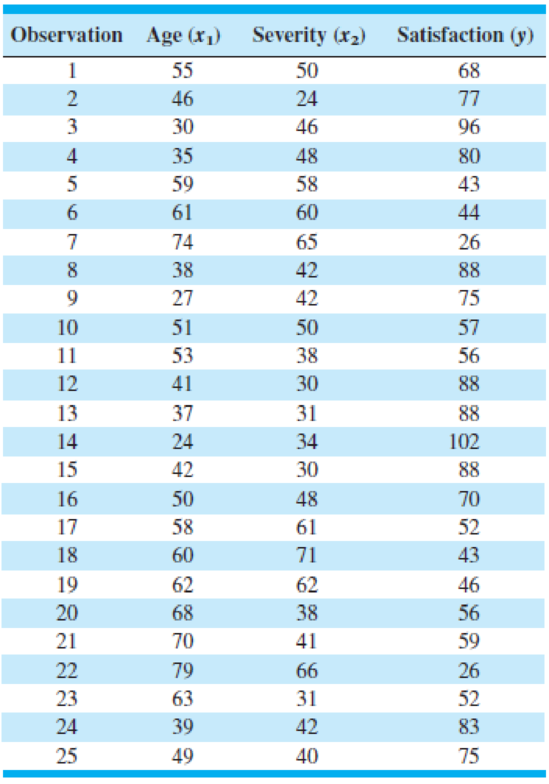
4.51. Reconsider the patient satisfaction data in Table 4E.11. Fit a multiple regression model using both patient age and severity as the regressors.
- (a) Test for significance of regression.
- (b) Test for the individual contribution of the two regressors. Are both regressor variables needed in the model?
- (c) Has adding severity to the model improved the quality of the model fit? Explain your answer.
TABLE 4E.11
Patient Satisfaction Data
Expert Solution & Answer
Want to see the full answer?
Check out a sample textbook solution
Chapter 4 Solutions
Introduction to Statistical Quality Control
Ch. 4 - Suppose that you are testing the following...Ch. 4 - Suppose that you are testing the following...Ch. 4 - Suppose that you are testing the following...Ch. 4 - Suppose that you are testing the following...Ch. 4 - Suppose that you are testing the following...Ch. 4 - Suppose that you are testing the following...Ch. 4 - The inside diameters of bearings used in an...Ch. 4 - The tensile strength of a fiber used in...Ch. 4 - The service life of a battery used in a cardiac...Ch. 4 - Using the data from Exercise 4.7, construct a 95%...
Ch. 4 - A new process has been developed for applying...Ch. 4 - A machine is used to fill containers with a liquid...Ch. 4 - Ferric chloride is used as a flux in some types of...Ch. 4 - The diameters of aluminum alloy rods produced on...Ch. 4 - The output voltage of a power supply is assumed to...Ch. 4 - Two machines are used for filling glass bottles...Ch. 4 - Two quality control technicians measured the...Ch. 4 - Suppose that x1N(,12) and x2N(2,22), and that x1...Ch. 4 - Two different hardening processes(1) saltwater...Ch. 4 - A random sample of 200 printed circuit boards...Ch. 4 - A random sample of 500 connecting rod pins...Ch. 4 - Two processes are used to produce forgings used in...Ch. 4 - A new purification unit is installed in a chemical...Ch. 4 - Two different types of glass bottles are suitable...Ch. 4 - The diameter of a metal rod is measured by 12...Ch. 4 - The cooling system in a nuclear submarine consists...Ch. 4 - An experiment was conducted to investigate the...Ch. 4 - Suppose we wish to test the hypotheses H0:=15H1:15...Ch. 4 - Consider the hypotheses H0:=0H1:0 where 2 is...Ch. 4 - Sample size allocation. Suppose we are testing the...Ch. 4 - Develop a test for the hypotheses H0: 1 = 2 H1: 1 ...Ch. 4 - Nonconformities occur in glass bottles according...Ch. 4 - An inspector counts the surface-finish defects in...Ch. 4 - An in-line tester is used to evaluate the...Ch. 4 - An article in Solid State Technology (May 1987)...Ch. 4 - Compare the mean etch uniformity values at each of...Ch. 4 - An article in the ACI Materials Journal (Vol. 84,...Ch. 4 - Compare the mean compressive strength at each...Ch. 4 - An aluminum producer manufactures carbon anodes...Ch. 4 - Plot the residuals from Exercise 4.36 against the...Ch. 4 - An article in Environmental International (Vol....Ch. 4 - An article in the Journal of the Electrochemical...Ch. 4 - The tensile strength of a paper product is related...Ch. 4 - A plant distills liquid air to produce oxygen,...Ch. 4 - Plot the residuals from Exercise 4.43 and comment...Ch. 4 - Plot the residuals from Exercise 4.44 and comment...Ch. 4 - The brake horsepower developed by an automobile...Ch. 4 - Analyze the residuals from the regression model in...Ch. 4 - Table 4E.11 contains the data from a patient...Ch. 4 - Analyze the residuals from the regression model on...Ch. 4 - Reconsider the patient satisfaction data in Table...Ch. 4 - Analyze the residuals from the multiple regression...Ch. 4 - Consider the Minitab output below. (a) Fill in the...Ch. 4 - Suppose that you are testing H0: 1 = 2 versus H1: ...Ch. 4 - Suppose that you are testing H0: = 2 versus H1: ...Ch. 4 - Consider the Minitab output below. (a) Fill in the...Ch. 4 - Consider the Minitab output shown below. (a) Is...Ch. 4 - Consider the Minitab output shown below. (a) Fill...Ch. 4 - Consider the Minitab output below. (a) Fill in the...Ch. 4 - Consider a one-way or single-factor ANOVA with...Ch. 4 - Consider the Minitab ANOVA output below. Fill in...
Additional Math Textbook Solutions
Find more solutions based on key concepts
To find the probability of getting a difference in sample mean 3051526=0.20=20%x¯M−x¯W and that is greater than...
PRACTICE OF STATISTICS F/AP EXAM
Children of First Ladies This list represents the number of children for the first six “first ladies” of the Un...
Introductory Statistics (2nd Edition)
Olympic Swimming Times The table shows the 100-meter backstroke and the 100-meter butterfly gold medal Olympic ...
Introductory Statistics
These are the scores on a test of sensitivity to smell taken by 25 chefs attending a national conference:
96, 8...
Statistics for Psychology
Hypothesis Testing Using a P-Value In Exercises 31–36,
identify the claim and state H0 and Ha.
find the standar...
Elementary Statistics: Picturing the World (7th Edition)
How much time do Americans living in or near cities spend waiting in traffic, and how much does waiting in traf...
Business Statistics: A First Course (7th Edition)
Knowledge Booster


Learn more about
Need a deep-dive on the concept behind this application? Look no further. Learn more about this topic, statistics and related others by exploring similar questions and additional content below.Similar questions
- Life Expectancy The following table shows the average life expectancy, in years, of a child born in the given year42 Life expectancy 2005 77.6 2007 78.1 2009 78.5 2011 78.7 2013 78.8 a. Find the equation of the regression line, and explain the meaning of its slope. b. Plot the data points and the regression line. c. Explain in practical terms the meaning of the slope of the regression line. d. Based on the trend of the regression line, what do you predict as the life expectancy of a child born in 2019? e. Based on the trend of the regression line, what do you predict as the life expectancy of a child born in 1580?2300arrow_forwardFind the equation of the regression line for the following data set. x 1 2 3 y 0 3 4arrow_forwardWhat is regression analysis? Describe the process of performing regression analysis on a graphing utility.arrow_forward
Recommended textbooks for you
 Functions and Change: A Modeling Approach to Coll...AlgebraISBN:9781337111348Author:Bruce Crauder, Benny Evans, Alan NoellPublisher:Cengage Learning
 Glencoe Algebra 1, Student Edition, 9780079039897...AlgebraISBN:9780079039897Author:CarterPublisher:McGraw Hill
 Calculus For The Life SciencesCalculusISBN:9780321964038Author:GREENWELL, Raymond N., RITCHEY, Nathan P., Lial, Margaret L.Publisher:Pearson Addison Wesley,
 Algebra & Trigonometry with Analytic GeometryAlgebraISBN:9781133382119Author:SwokowskiPublisher:Cengage
 Algebra and Trigonometry (MindTap Course List)AlgebraISBN:9781305071742Author:James Stewart, Lothar Redlin, Saleem WatsonPublisher:Cengage Learning
Functions and Change: A Modeling Approach to Coll...
Algebra
ISBN:9781337111348
Author:Bruce Crauder, Benny Evans, Alan Noell
Publisher:Cengage Learning
Glencoe Algebra 1, Student Edition, 9780079039897...
Algebra
ISBN:9780079039897
Author:Carter
Publisher:McGraw Hill
Calculus For The Life Sciences
Calculus
ISBN:9780321964038
Author:GREENWELL, Raymond N., RITCHEY, Nathan P., Lial, Margaret L.
Publisher:Pearson Addison Wesley,
Algebra & Trigonometry with Analytic Geometry
Algebra
ISBN:9781133382119
Author:Swokowski
Publisher:Cengage
Algebra and Trigonometry (MindTap Course List)
Algebra
ISBN:9781305071742
Author:James Stewart, Lothar Redlin, Saleem Watson
Publisher:Cengage Learning
Correlation Vs Regression: Difference Between them with definition & Comparison Chart; Author: Key Differences;https://www.youtube.com/watch?v=Ou2QGSJVd0U;License: Standard YouTube License, CC-BY
Correlation and Regression: Concepts with Illustrative examples; Author: LEARN & APPLY : Lean and Six Sigma;https://www.youtube.com/watch?v=xTpHD5WLuoA;License: Standard YouTube License, CC-BY