
Financial Reporting, Financial Statement Analysis and Valuation
8th Edition
ISBN: 9781285190907
Author: James M. Wahlen, Stephen P. Baginski, Mark Bradshaw
Publisher: Cengage Learning
expand_more
expand_more
format_list_bulleted
Videos
Textbook Question
Chapter 4, Problem 22PC
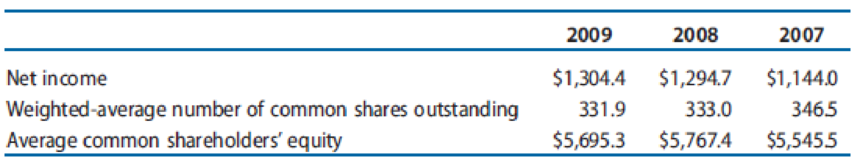
Selected data for General Mills for 2007, 2008, and 2009 appear below (amounts in millions).
REQUIRED
- a. Compute the rate of ROCE for 2007, 2008, and 2009.
- b. Compute basic EPS for 2007, 2008, and 2009.
- c. Interpret the changes in ROCE versus EPS over the three-year period.
Expert Solution & Answer

Trending nowThis is a popular solution!

Students have asked these similar questions
1. Compute the following ratios for the comparative periods (2018 and 2019). The company used 365 days in its computation for some of the ratios. Show your solution.
a. Working Capital
b. Current Ratio
c. Acid Test Ratio
d. Accounts Receivable Turnover Ratio
e. Average Collection Period
f. Inventory Turnover Ratio
g. Average Days in Inventory
h. Number of days in Operating Cycle
i. Debt to Total Assets Ratio
j. Debt to Equity Ratio
k. Times Interest Earned Ratio
l. Gross Profit Ratio
m. Profit Margin Ratio
n. Return on Assets
o. Return on Equity
p. Assets Turnover Ratio
Here is the operating data for Yalis Cleaning, Inc.:
After analyzing the transactions, prepare a vertical analysis schedule for the company for 2021 and 2020 using service revenue as the base amount. Round percentages to two decimal places.
Compute the following ratios. Note: Use a 360-day year. Do not round intermediate calculations. Input your profit margin, return on assets, return on equity, and debt to total assets answers as a percent rounded to 2 decimal places. Round all other answers to 2 decimal places.
Jones Corp Smith Corp
Find the profit margin, return on assets(investments), return on equity, receivable turnover, average collection period, inventory turnover, fixed asset turnover, total asset turnover, current ratio, quick ratio, debt to total assets, times interest earned, and fixed charge coverage. For each Corporation.
Chapter 4 Solutions
Financial Reporting, Financial Statement Analysis and Valuation
Ch. 4 - Common-Size Analysis. Common-size analysis is a...Ch. 4 - Earnings per Share. Firm A reports an increase in...Ch. 4 - Prob. 3QECh. 4 - Profit Margin for ROA versus ROCE. Describe the...Ch. 4 - Concept and Measurement of Financial Leverage....Ch. 4 - Advantages of Financial Leverage. A company...Ch. 4 - Prob. 7QECh. 4 - Nucor, a steel manufacturer, reported net income...Ch. 4 - Phillips-Van Heusen, an apparel manufacturer,...Ch. 4 - TJX, Inc., an apparel retailer, reported net...
Ch. 4 - Boston Scientific, a medical device manufacturer,...Ch. 4 - Valero Energy, a petroleum company, reported net...Ch. 4 - Exhibit 4.22 presents selected operating data for...Ch. 4 - Microsoft Corporation (Microsoft) and Oracle...Ch. 4 - Prob. 17PCCh. 4 - Prob. 18PCCh. 4 - Texas Instruments (TI) designs and manufactures...Ch. 4 - JCPenney operates a chain of retail department...Ch. 4 - Prob. 21PCCh. 4 - Selected data for General Mills for 2007, 2008,...Ch. 4 - Prob. 23PCCh. 4 - Hasbro is a leading firm in the toy, game, and...Ch. 4 - Fitch sells casual apparel and personal care...Ch. 4 - Prob. 26PCCh. 4 - Starwood Hotels (Starwood) owns and operates many...Ch. 4 - Select data for Avis and Hertz for 2012 follow....Ch. 4 - Integrative Case 1.1 introduced the industry...Ch. 4 - Prob. 1ABICCh. 4 - Prob. 1ACICCh. 4 - Prob. 1BAICCh. 4 - Prob. 1BBICCh. 4 - Walmart and Carrefour follow similar strategies....Ch. 4 - Walmart and Carrefour follow similar strategies....
Knowledge Booster


Learn more about
Need a deep-dive on the concept behind this application? Look no further. Learn more about this topic, finance and related others by exploring similar questions and additional content below.Similar questions
- Jinchuriki Inc.'s Financial Statement for years 2014-2015. Compute of the Average Collection Period.arrow_forwardSummary financial information for Gandaulf Company is as follows. Compute the amount and percentage changes in 2022 using horizontal analysis, assuming 2024 is the base year. (Enter negative amounts and percentages using either a negative sign preceding the number e.g. -45,-45% or parentheses e.g. (45), (45%). Round percentages to 2 decimal places, e.g. 1.25%.) Current Assets Dec. 31, 2022 Dec. 31, 2024 $191,100 $210,000 $ Plant Assets 1,058,600 790,000 Total assets $1,249,700 $1,000,000 $ Increase (Decrease) in 2022 Amount Percent % % %arrow_forward1. Compute the following ratios for the comparative periods (2018 and 2019). The company used 365 days in its computation for some of the ratios. Show your solution. d. Accounts Receivable Turnover Ratio e. Average Collection Period f. Inventory Turnover Ratio g. Average Days in Inventory h. Number of days in Operating Cycle i. Debt to Total Assets Ratio j. Debt to Equity Ratio k. Times Interest Earned Ratio l. Gross Profit Ratio m. Profit Margin Ratio n. Return on Assets o. Return on Equity p. Assets Turnover Ratioarrow_forward
- Compute trend percents for the above accounts, using 2017 as the base year. For each of the three accounts, state whether the situation as revealed by the trend percents appears to be favorable or unfavorable. Sales $ 666,761 $ 432,962 $ 344,990 $ 249,090 $ 180,500 Cost of goods sold 329,263 213,901 172,445 124,054 88,445 Accounts receivable 32,138 25,242 23,632 14,547 12,328arrow_forwardRequired 1. Compute each year’s current ratio. Round ratios to one decimal. 2. Express the income statement data in common-size percents. Round percents to two decimals. 3. Express the balance sheet data in trend percents with 2017 as the base year. Round percents to two decimals. Analysis Component 4. Comment on any significant relations revealed by the ratios and percents computed.arrow_forwardCalculate the following ratios for 2021 using working Excel formulas. Make sure to label each appropriately using the following cell (number of days, number of times, etc.) Round each answer to 2 decimal places (example: ROE of .1678 should display as 16.78%): Current Ratio Quick Ratio Debt to Equity Ratio Equity Multiplier Times Interest Earned Dividend Yield Inventory Turnover Days’ Sales in Inventory Receivables Turnover Days’ Sales in Receivables Total Asset Turnover Profit Margin Return on Assets Return on Equity P/E Ratio 2.Calculate Return on Equity (ROE) for 2021 using the Dupontarrow_forward
- Count the average of these weights for all three years. Please note that you are to assign weights of 3, 2 and 1 to the financial ratios for FISCAL YEAR 2019, FISCAL YEAR 2018 and FISCAL YEAR 2017 and then compute the weighted average. Current Ratlo Particulars FY'19 L&T BHEL NBCC 1.3 1.59 1.08 Slemens 191 FY'18 FY'17 132 1.44 1.83 1.96 1.18 1.26 1.82 ▷arrow_forwardNet sales revenue, net income, and common stockholders' equity for Eyesight Mission Corporation, a manufacturer of contact lenses, follow for a four-year period. E (Click the icon to view the net sales revenue, net income, and common equity) Read the requirements. Requirement 1. Compute trend analyses for each item for 2017-2019. Use 2016 as the base year, and round to the nearest whole percent. Begin by computing Eyesight Mission Corporation's trend analysis for net sales revenue, then compute Eyesignt Mission Corporation's trend analysis for net income and finally compute Eyesight Mission Corporation's trend analysis for com 2019 2018 2017 2016 Net Sales Revenue 766,000 708,000 644.000 664,000 Trend Percentages 115 % 107 % 97 % 100 % Net Income 60,000 $4 38,000 $ 36.000 2. 44.000 Trend Percentages 136 % 86 % 82 % 100 % Ending Common Stockholdors' Equity 368,000 352 000 $ 326,000 $ 296,000 Trend Percentages 124 % 119 % 110 100 % % OTI Requirement 2. Compute the rate of return on…arrow_forwardThe condensed financial statements of Ivanhoe Company for the years 2020-2021 are presented below: (See Images) Compute the following financial ratios by placing the proper amounts for numerators and denominators. (Round per unit answers to 2 decimal places, e.g. 52.75.) (a) Current ratio at 12/31/21 $ $ (b) Acid test ratio at 12/31/21 $ $ (c) Accounts receivable turnover in 2021 $ $ (d) Inventory turnover in 2021 $ $ (e) Profit margin on sales in 2021 $ $ (f) Earnings per share in 2021 $ (g) Return on common stockholders’ equity in 2021 $ $ (h) Price earnings ratio at 12/31/21 $ $ (i) Debt to assets at 12/31/21 $ $ (j) Book value per share at 12/31/21 $arrow_forward
- 2) Ratios Based on the information given in picture #1, complete the following ratios for the last TWO years and indicate whether the trend is favorable or unfavorable. Note percentages and times should be to one decimal place (e.g. 14.8%; 5.8x) Liq./Solv. Ratios Current Yr. Prior Yr. Fav/Unfav. Current Ratio (X) {Total. Current Assets/ Total Current Liabilities} Quick Ratio (X) {Cash + Short term Investments + Current Receivables/ Current Liabilities} Day's Sales Uncollected (days) {Total Accounts Receivables / Sales x 365}arrow_forwardUsing available data in the case, calculate the requested financial ratios. Round all numbers to the nearest hundredth. For example, answers should look like -0.05 or 1.33. Use the following table to calculate Current Ratios for the years 2014, 2015, and 2016: Year 2014 2015 2016 Current Assets Current Liabilities 6,086 5,914 8,137 ROA ROE Current Ratio 2016 0.78 % % 8,532 8,516 10,397 2015 0.69 % % 2014 0.71 % %arrow_forwardFINANCIAL RATIO: Requirement: Compute for the following financial ratios for the year 2021 (round-off answers to two decimal places) a. Current ratio b. Quick (Acid-test) ratio c. Working capital d. Inventory turnover e. Days of inventory (use 365 days) f. Accounts receivable turnover (assume all sales are on credit) g. Days of receivable (use 365 days) h. Debt ratio i. Equity ratio j. Debt-to-equity ratio k. Gross profit ratio 1. Net profit ratio m. Return on assets n. Return on equityarrow_forward
arrow_back_ios
SEE MORE QUESTIONS
arrow_forward_ios
Recommended textbooks for you
 Financial Reporting, Financial Statement Analysis...FinanceISBN:9781285190907Author:James M. Wahlen, Stephen P. Baginski, Mark BradshawPublisher:Cengage Learning
 Cornerstones of Financial AccountingAccountingISBN:9781337690881Author:Jay Rich, Jeff JonesPublisher:Cengage Learning
Financial Reporting, Financial Statement Analysis...
Finance
ISBN:9781285190907
Author:James M. Wahlen, Stephen P. Baginski, Mark Bradshaw
Publisher:Cengage Learning
Cornerstones of Financial Accounting
Accounting
ISBN:9781337690881
Author:Jay Rich, Jeff Jones
Publisher:Cengage Learning
Earnings per share (EPS), basic and diluted; Author: Bionic Turtle;https://www.youtube.com/watch?v=i2IJTpvZmH4;License: Standard Youtube License