
FINANCIAL ACCOUNTING
10th Edition
ISBN: 9781259964947
Author: Libby
Publisher: MCG
expand_more
expand_more
format_list_bulleted
Related questions
Question
2) Ratios
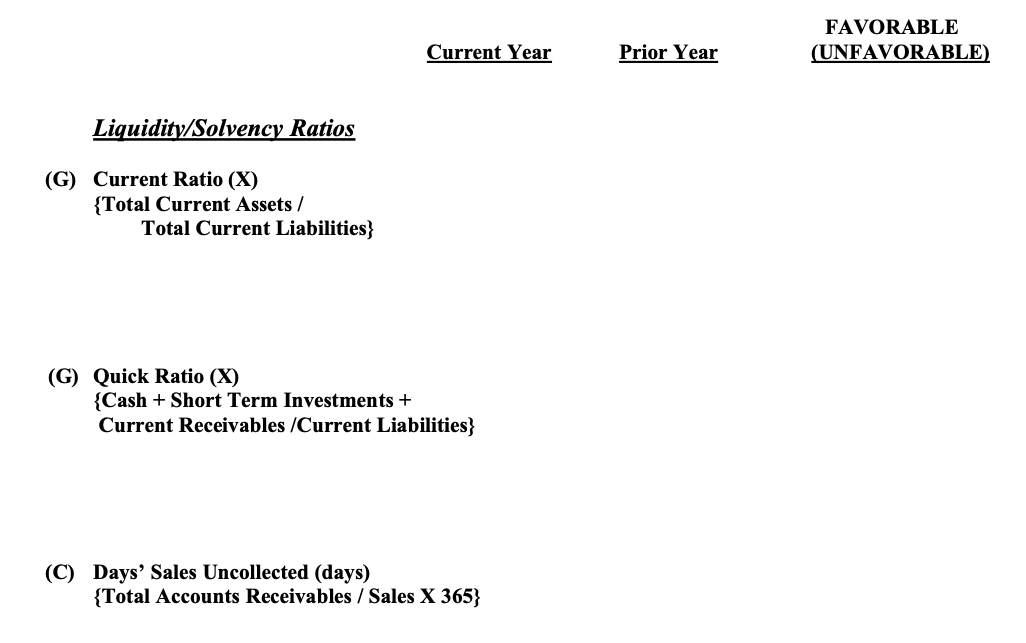
Based on the information given in picture #1, complete the following ratios for the last TWO years and indicate whether the trend is favorable or unfavorable. Note percentages and times should be to one decimal place (e.g. 14.8%; 5.8x)
Liq./Solv. Ratios Current Yr. Prior Yr. Fav/Unfav.
{Total. Current Assets/
Total Current Liabilities}
Quick Ratio (X)
{Cash + Short term Investments +
Current Receivables/ Current Liabilities}
Day's Sales Uncollected (days)
{Total

Transcribed Image Text:FAVORABLE
Current Year
Prior Year
(UNFAVORABLE)
Liquidity/Solvency Ratios
(G) Current Ratio (X)
{Total Current Assets /
Total Current Liabilities}
(G) Quick Ratio (X)
{Cash + Short Term Investments +
Current Receivables /Current Liabilities}
(C) Days' Sales Uncollected (days)
{Total Accounts Receivables / Sales X 365}

Transcribed Image Text:1- Key Statistices: (OMIT ALL ZEROS 000); if none, leave blank
Income Statement
(2020)
Current Year
406,785
(201G)
Prior Year
Increase(Decrease)
Sales/Revenue
297,897
T 108, 888
+ 75,698
97,285 + 33,190
(12,443) (40,30 a) 3247.
37/-
387.
347
276,310
200, 612
Cost of Goods Sold
130,475
(s2,752)
Gross Income
Net Income
Balance Sheet
End of
Current Year
End of
Increase (Decrease)
Prior Year
275,988 (116, 061) -42%.
40, 080 (410s)-10%.
40,121 491.
Cash & Short-term investments
|59,127
Total Accounts Reccivable
35,975
veatories
12, 귀구
81,596
332, 226
Net Property, Plant & Equipment 129,869
403, 594 (74,366) -18/.
47/47 니 +82,39S 1747.
Total Current Assets
Intangible Assets
4 SI, 923 +i br077 4%
26,923 + 261148
4구,697 +41, 2구 0
67,833 +3 3,076 497
384,090 (14,993) -47.
Total Assets
46४,००6
977.
Accounts Payable
53,071
877.
88,967
Total Current Liabilities
Total Linbilities
100,90a
Total Shareholders' Equity
36구,097
Asset Compoition:
End of Current Year
% of Total Assets
Largest Assets: (from above)
Net property ,Plant
1. tequipmeAAA
casn + Snort term
2.iA Amen
129869
I54,127
-42%.
491.
3. Innentoriey
12/,717
Expert Solution
This question has been solved!
Explore an expertly crafted, step-by-step solution for a thorough understanding of key concepts.

Step by stepSolved in 2 steps with 1 images

Knowledge Booster


Learn more about
Need a deep-dive on the concept behind this application? Look no further. Learn more about this topic, accounting and related others by exploring similar questions and additional content below.Similar questions
- Consider this simplified balance sheet for Geomorph Trading: Current assets Long-term assets $ 245 Current liabilities Long-term debt 630 Other liabilities Equity $ 875 Required: a. What is the company's debt-equity ratio? (Hint: debt = Current liabilities, Long-term debt, and Other liabilities) Note: Round your answer to 2 decimal places. b. What is the ratio of total long-term debt to total long-term capital? Note: Round your answer to 2 decimal places. c. What is its net working capital? d. What is its current ratio? Note: Round your answer to 2 decimal places. $ 170 215 140 350 $ 875 a Debt-equity ratio b. Long-term debt-to-capital ratio c. Net working capital d. Current ratioarrow_forwardCurrent Position Analysis The following data were taken from the balance sheet of Nilo Company at the end of two recent fiscal years: Current Year Previous Year Current assets: Cash Marketable securities Accounts and notes receivable (net) Inventories Prepaid expenses Total current assets Current liabilities: Accounts and notes payable (short-term) Accrued liabilities Total current liabilities a. Determine for each year (1) the working Current Year 1. Working capital 2. Current ratio 3. Quick ratio b. The liquidity of Nilo has current assets relative to current liabilities. $690,500 799,500 327,000 1,042,800 537,200. $3,397,000 $458,200 $579,600 652,100 217,300 673,400 430,600 $2,553,000 $483,000 331,800 207,000 $790,000 $690,000 capital, (2) the current ratio, and (3) the quick ratio. Round ratios to one decimal place. Previous Year from the preceding year to the current year. The working capital, current ratio, and quick ratio have all . Most of these changes are the result of an inarrow_forwardResolve and explain the result of the current ratio for XYZ Company and compare andexplain this result with the Industry average, where current liabilities = $581,000 andcurrent assets = $832,000. a. Resolve the current ratio for XYZ Company b.Explain the result of the current ratio for XYZ Company c.Compare and explain the result of the current ratio for XYZ Company with the Industryaverage.arrow_forward
- Vertical Analysis of Balance Sheet Balance sheet data for a company for the years ended December 31, 20Y2 and 20Y1, are shown below. 20Y2 20Υ1 Current assets $ 752,000 $ 602,000 Property, plant, and equipment 6,248,000 5,397,000 Intangible assets 1,000,000 1,001,000 Current liabilities 504,000 427,000 Long-term liabilities 1,504,000 1,197,000 Common stock 1,248,000 1,253,000 Retained earnings 4,744,000 4,123,000 | Prepare a comparative balance sheet for 20Y2 and 20Y1, stating each asset as a percent of total assets and each liability and stockholders' equity item as a percent of the total liabilities and stockholders' equity. Round your answers to one decimal place. Comparative Balance Sheet December 31, 20Y2 and 20Y1 20Y2 Amount 20Y2 Percent 20Y1 Amount 20Y1 Percent Assets Current assets $752,000 % $602,000 % Property, plant, and equipment 6,248,000 5,397,000 Intangible assets 1,000,000 1,001,000arrow_forward2) Ratios Based on the information given in picture #1, complete the following ratios for the last TWO years and indicate whether the trend is favorable or unfavorable. Note percentages and times should be to one decimal place (e.g. 14.8%; 5.8x) Liq./Solv. Ratios Current Yr. Prior Yr. Fav/Unfav. Current Ratio (X) {Total. Current Assets/ Total Current Liabilities} Quick Ratio (X) {Cash + Short term Investments + Current Receivables/ Current Liabilities} Day's Sales Uncollected (days) {Total Accounts Receivables / Sales x 365}arrow_forward2) Ratios Based on the information given in picture #1, complete the following ratios for the last TWO years and indicate whether the trend is favorable or unfavorable. Note percentages and times should be to one decimal place (e.g. 14.8%; 5.8x) Profitability Ratios Current Yr. Prior Yr. Fav/Unfav. Gross Margin (%) {Gross Income/Sales Revenue} Profit Margin (%) {Net income/ Sales Revenue} Return on Assets (%) {Net Income/ Average Total Assets}arrow_forward
- Required: 1. Complete the following columns for each item in the comparative financial statements (Negative answers shoul be indicated by a minus sign. Round percentage answers to 2 decimal places, i.e., 0.1243 should be entered as 12.43.): Increase (Decrease) Year 2 over Year 1 Amount Percentage Statement of earnings: Sales revenue Cost of sales Gross margin Operating expenses and interest expense Earnings before income taxes Income tax expense Net earnings $ 45,770 38,650 7,120 4,020 3,100 1,050 $ 2,050 Statement of financial position: Cash (4,720) Accounts receivable (net) (4,220) Inventory 6,200 Property, plant, and equipment (net) 6,380 $ 3,640 Current liabilities (3,840) Long-term debt 3,530 Common shares 0 Retained earnings 3,950 $ 3,640arrow_forwardplease answer within the format by providing formula the detailed workingPlease provide answer in text (Without image)Please provide answer in text (Without image)Please provide answer in text (Without image)arrow_forwardPlease fill out vertical analysis of this balance sheet to determine component percentage of assets liabilities and stockholders equity based on data. Round percentages to the nearest hundredths percentarrow_forward
- Accounting Questionarrow_forwardCount the average of these weights for all three years. Please note that you are to assign weights of 3, 2 and 1 to the financial ratios for FISCAL YEAR 2019, FISCAL YEAR 2018 and FISCAL YEAR 2017 and then compute the weighted average. Current Ratlo Particulars FY'19 L&T BHEL NBCC 1.3 1.59 1.08 Slemens 191 FY'18 FY'17 132 1.44 1.83 1.96 1.18 1.26 1.82 ▷arrow_forwardPlease do not give image format and explanationarrow_forward
arrow_back_ios
SEE MORE QUESTIONS
arrow_forward_ios
Recommended textbooks for you
 AccountingAccountingISBN:9781337272094Author:WARREN, Carl S., Reeve, James M., Duchac, Jonathan E.Publisher:Cengage Learning,
 Accounting Information SystemsAccountingISBN:9781337619202Author:Hall, James A.Publisher:Cengage Learning,
 Horngren's Cost Accounting: A Managerial Emphasis...AccountingISBN:9780134475585Author:Srikant M. Datar, Madhav V. RajanPublisher:PEARSON
 Intermediate AccountingAccountingISBN:9781259722660Author:J. David Spiceland, Mark W. Nelson, Wayne M ThomasPublisher:McGraw-Hill Education
 Financial and Managerial AccountingAccountingISBN:9781259726705Author:John J Wild, Ken W. Shaw, Barbara Chiappetta Fundamental Accounting PrinciplesPublisher:McGraw-Hill Education
Accounting
Accounting
ISBN:9781337272094
Author:WARREN, Carl S., Reeve, James M., Duchac, Jonathan E.
Publisher:Cengage Learning,
Accounting Information Systems
Accounting
ISBN:9781337619202
Author:Hall, James A.
Publisher:Cengage Learning,
Horngren's Cost Accounting: A Managerial Emphasis...
Accounting
ISBN:9780134475585
Author:Srikant M. Datar, Madhav V. Rajan
Publisher:PEARSON
Intermediate Accounting
Accounting
ISBN:9781259722660
Author:J. David Spiceland, Mark W. Nelson, Wayne M Thomas
Publisher:McGraw-Hill Education
Financial and Managerial Accounting
Accounting
ISBN:9781259726705
Author:John J Wild, Ken W. Shaw, Barbara Chiappetta Fundamental Accounting Principles
Publisher:McGraw-Hill Education