
Financial Reporting, Financial Statement Analysis and Valuation
8th Edition
ISBN: 9781285190907
Author: James M. Wahlen, Stephen P. Baginski, Mark Bradshaw
Publisher: Cengage Learning
expand_more
expand_more
format_list_bulleted
Videos
Textbook Question
Chapter 4, Problem 28PC
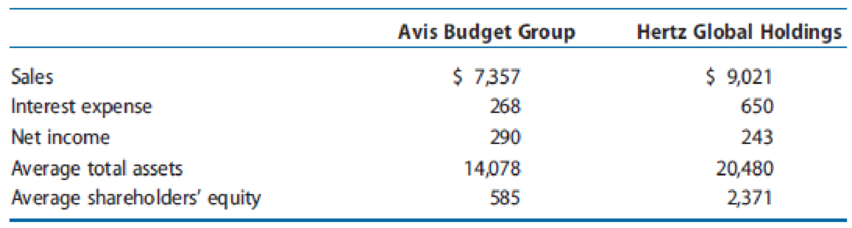
Select data for Avis and Hertz for 2012 follow. Based only on this information and ratios that you construct, speculate on similarities and differences in the operations and financing decisions of the two companies based on similarities and differences in the ratios.
Expert Solution & Answer
Want to see the full answer?
Check out a sample textbook solution
Students have asked these similar questions
You are provided with the Income Statement and the Balance Sheet of HTS software, Inc. for 2011.
Required:
(a) Calculate the ratios stated in the table below for HTS Software, Inc. for 2011
(b) Analyze the current financial position for the company from a time series and cross section viewpoint.
(c) Break your analysis into an evaluation of the firm’s liquidity, activity, debt, profitability and market ratios.
Historical and Industry Average Ratios
HTS Software , Inc.
Ratio
2010
2011
Industry2011
Current Ratio
2.6
—
2.7
Quick Ratio
1.8
—
1.75
Inventory Turnover
4.5
—
4.7
Average Collection Period
40days
—
42 days
Total Asset Turnover
1.2
—
1
Debt Ratio
20%
—
21%
Times Interest Earned
9
—
8.9
Gross Profit Margin
43%
—
44%
Operating Profit Margin
30%
—
32%
Net Profit Margin
20%
—
21%
Return on total assets
12%
—
13%
Return on Equity
Price/Earnings Ratio…
For each individual ratio for each company, Your comments for each ratio should include more than just a definition or increase or decrease of the ratio. You should focus on interpreting each ratio numberfor the company and support your comments.
Use the ratio results by category to form and support conclusion by Liquidity, Solvency and Profitability. Then use to complete the Overall Conclusion as to the financial results of the company (ratios described in the chapters covered and summarized in Chapter 14 of your textbook). Conclude by stating whether the company is the better employment /investment opportunity and why.
Stargel Inc.
Comparative Balance Sheet
December 31, 20Y2 and 20Y1
20Y2
20Y1
Assets
Current assets:
Cash
$500,000
$400,000
Marketable securities
1,010,000
1,000,000
Accounts receivable (net)
740,000
510,000
Inventories
1,190,000
950,000
Prepaid expenses
250,000
229,000
Total current assets…
Chapter 4 Solutions
Financial Reporting, Financial Statement Analysis and Valuation
Ch. 4 - Common-Size Analysis. Common-size analysis is a...Ch. 4 - Earnings per Share. Firm A reports an increase in...Ch. 4 - Prob. 3QECh. 4 - Profit Margin for ROA versus ROCE. Describe the...Ch. 4 - Concept and Measurement of Financial Leverage....Ch. 4 - Advantages of Financial Leverage. A company...Ch. 4 - Prob. 7QECh. 4 - Nucor, a steel manufacturer, reported net income...Ch. 4 - Phillips-Van Heusen, an apparel manufacturer,...Ch. 4 - TJX, Inc., an apparel retailer, reported net...
Ch. 4 - Boston Scientific, a medical device manufacturer,...Ch. 4 - Valero Energy, a petroleum company, reported net...Ch. 4 - Exhibit 4.22 presents selected operating data for...Ch. 4 - Microsoft Corporation (Microsoft) and Oracle...Ch. 4 - Prob. 17PCCh. 4 - Prob. 18PCCh. 4 - Texas Instruments (TI) designs and manufactures...Ch. 4 - JCPenney operates a chain of retail department...Ch. 4 - Prob. 21PCCh. 4 - Selected data for General Mills for 2007, 2008,...Ch. 4 - Prob. 23PCCh. 4 - Hasbro is a leading firm in the toy, game, and...Ch. 4 - Fitch sells casual apparel and personal care...Ch. 4 - Prob. 26PCCh. 4 - Starwood Hotels (Starwood) owns and operates many...Ch. 4 - Select data for Avis and Hertz for 2012 follow....Ch. 4 - Integrative Case 1.1 introduced the industry...Ch. 4 - Prob. 1ABICCh. 4 - Prob. 1ACICCh. 4 - Prob. 1BAICCh. 4 - Prob. 1BBICCh. 4 - Walmart and Carrefour follow similar strategies....Ch. 4 - Walmart and Carrefour follow similar strategies....
Knowledge Booster


Learn more about
Need a deep-dive on the concept behind this application? Look no further. Learn more about this topic, finance and related others by exploring similar questions and additional content below.Similar questions
- You are provided with the Income Statement and the Balance Sheet of HTS software, Inc. for 2011.Required: (a) Calculate the ratios stated in the table below for HTS Software, Inc. for 2011 (b) Analyze the current financial position for the company from a time series and cross section viewpoint. (c) Break your analysis into an evaluation of the firm’s liquidity, activity, debt, profitability and market ratios.arrow_forwardCritically Discuss the two statements below. A. Ratio is an expression of relationship between two or more items in mathematical terms. Ratio may be expressed as a:b (a is to b), in terms of simple fraction, integer, or percentage. B. A Finance Manager can utilize financial ratios and completely analyse any firm's financial performance without the need for any further financial review via any other company's data.arrow_forwardYou are given financial statements and a Dupont analysis for Tesco and Ahold. What do you conclude about the two companies’ performances based on these numbers?arrow_forward
- analyze a campany's liquidity and solvency by using simple financial ratios. here you will answer questions relayed to saturn sales comapny ltd. analyze the both financial statements and answer the following question.arrow_forwardVII. Direction: Compute and interpret. The following comparative financial statements are provided by Avatar Industries. You were asked to compute the different financial ratios and provide your interpretations with regards to profitability, efficiency, liquidity and solvency of the company. Use the Answer Sheet template below to input your answer and solution. AVATAR INDUSTRIES AVATAR INDUSTRIES Comparative Statement of Financial Position For the years 2019 and 2018 Comparative Income Statement For the years 2019 and 2018 2019 2018 2019 2018 ASSETS Current Assets: Sales P200,000 P210,000 Cash & Cash Equivalent P65,000 P70,000 Sales Returns and Allowances 40,000 25,000 Accounts Receivable 40,000 35,000 Net Sales 160,000 185,000 Marketable Secuities 40,000 35,000 Cost of Goods Sold 100,000 115,625 Inventory 100,000 80,000 Gross Profit 60,000 69,375 Total Current Assets 220,000 200,000 160,000 P445,000 P380,000 245,000 Operating Expenses: Fixed Assets Selling Expenses 22,000 25,000 Total…arrow_forwardVII. Direction: Compute and interpret. The following comparative financial statements are provided by Avatar Industries. You were asked to compute the different financial ratios and provide your interpretations with regards to profitability, efficiency, liquidity and solvency of the company. Use the Answer Sheet template below to input your answer and solution. AVATAR INDUSTRIES AVATAR INDUSTRIES Comparative Statement of Financial Position For the years 2019 and 2018 Comparative Income Statement For the years 2019 and 2018 2019 2018 2019 2018 ASSETS Current Assets: Sales P200,000 P210,000 Cash & Cash Equivalent P65,000 P70,000 Sales Returns and Allowances 40,000 25,000 Accounts Receivable 40,000 35,000 Net Sales 160,000 185,000 Marketable Securities 40,000 35,000 Cost of Goods Sold 100,000 115,625 Inventory 100,000 80,000 Gross Profit 60,000 69,375 Total Current Assets 245,000 220,000 Operating Expenses: Fixed Assets 200,000 160,000 Selling Expenses 22,000 25,000 Total Assets P445,000…arrow_forward
- determine the following ratios for both companies, then based on the information analvze and compare the two companies' solvency and profitability. Ratios: Return on total assets Return on stockholders' equity Times interest earned Ratio of total liabilities to stockholders' equity.arrow_forwarda) Compute the above indicated ratios for DEL Bhd. b) Evaluate the overall performance of the company as compared to the industry average ratios.arrow_forwardHow you can assess the company’s performance with financial ratios? Select any company and analyzes the current situation of financial statements with the help of rations.arrow_forward
- A company’s comparative statements are given below. Please conduct the following analyses: c. Calculate the three profitability ratios for year 2017 and show how ROE can be derived from the DuPont formula for this company. d. What do the analyses tell you about the company’s financial performance?arrow_forwardBase on this financial ratios, what are your conclusions and recommendations for the companyarrow_forward- Please refer to the following Income Statement and Balance Sheet (see attached picture): Prepare a vertical analysis for both the income statement and balance sheet. Write a paragraph comparing the company’s performance with the industry average. Compute the following ratios and comment on what the results mean when evaluating the company: Current ratio Gross profit percentage ratio Debt ratio Profit margin ratioarrow_forward
arrow_back_ios
SEE MORE QUESTIONS
arrow_forward_ios
Recommended textbooks for you
 Financial Reporting, Financial Statement Analysis...FinanceISBN:9781285190907Author:James M. Wahlen, Stephen P. Baginski, Mark BradshawPublisher:Cengage Learning
Financial Reporting, Financial Statement Analysis...
Finance
ISBN:9781285190907
Author:James M. Wahlen, Stephen P. Baginski, Mark Bradshaw
Publisher:Cengage Learning
Financial ratio analysis; Author: The Finance Storyteller;https://www.youtube.com/watch?v=MTq7HuvoGck;License: Standard Youtube License