
Concept explainers
Videos
(a)
To make a
(a)
Explanation of Solution
The scatterplot with rushing yards as the explanatory variable is as:
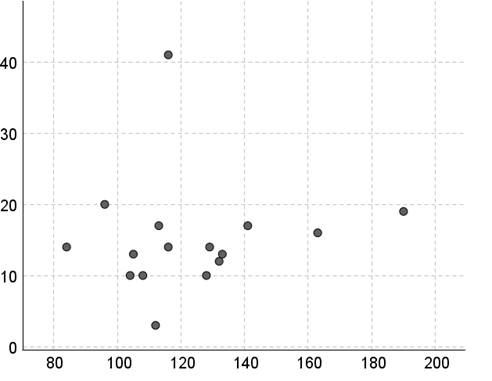
From the scatterplot we can say that, the scatterplot confirms a positive linear relationship, because the scatterplot slopes upwards. The scatterplot confirms a weak relationship, because the points seem to lie far apart.
(b)
To explain what effect do you think this game has on the
(b)
Answer to Problem 70E
The game
Explanation of Solution
For the case with outlier:
Using calculator, press on STAT and then select
Next, press on STAT select CALC and then select
Finally, pressing on ENTER then gives us the following result:
This then implies the regression line as:
For the case without outlier:
Using calculator, press on STAT and then select
Next, press on STAT select CALC and then select
Finally, pressing on ENTER then gives us the following result:
This then implies the regression line as:
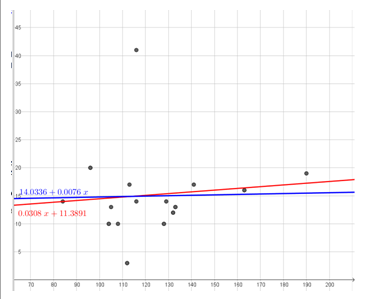
Thus, we note that the correlation coefficient with the outlier is more than the correlation coefficient without outlier. We then note that the outlier increases the correlation due to the fact that game
(c)
To explain what effect do you think this game has on the correlation and on the equation of the least squares regression line and calculate the correlation and equation of the least squares regression line with and without this game to confirm your answer.
(c)
Answer to Problem 70E
The game
Explanation of Solution
For the case with outlier:
Using calculator, press on STAT and then select
Next, press on STAT select CALC and then select
Finally, pressing on ENTER then gives us the following result:
This then implies the regression line as:
For the case without outlier:
Using calculator, press on STAT and then select
Next, press on STAT select CALC and then select
Finally, pressing on ENTER then gives us the following result:
This then implies the regression line as:
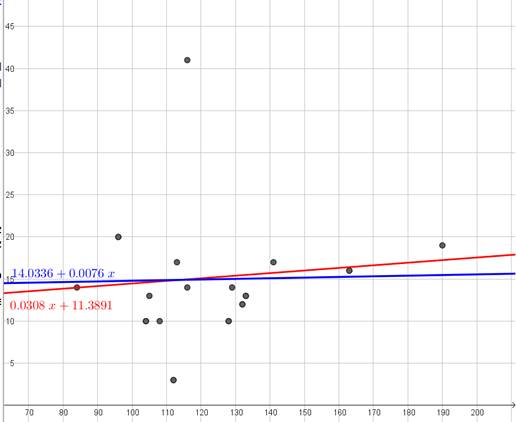
Thus, we note that the correlation coefficient with the outlier is more than the correlation coefficient without outlier. Then the game
Chapter 3 Solutions
PRACTICE OF STATISTICS F/AP EXAM
Additional Math Textbook Solutions
Introductory Statistics (2nd Edition)
Introductory Statistics
Essentials of Statistics (6th Edition)
Introductory Statistics
Fundamentals of Statistics (5th Edition)
Statistics for Business and Economics (13th Edition)


 MATLAB: An Introduction with ApplicationsStatisticsISBN:9781119256830Author:Amos GilatPublisher:John Wiley & Sons Inc
 Probability and Statistics for Engineering and th...StatisticsISBN:9781305251809Author:Jay L. DevorePublisher:Cengage Learning
 Statistics for The Behavioral Sciences (MindTap C...StatisticsISBN:9781305504912Author:Frederick J Gravetter, Larry B. WallnauPublisher:Cengage Learning
 Elementary Statistics: Picturing the World (7th E...StatisticsISBN:9780134683416Author:Ron Larson, Betsy FarberPublisher:PEARSON
 The Basic Practice of StatisticsStatisticsISBN:9781319042578Author:David S. Moore, William I. Notz, Michael A. FlignerPublisher:W. H. Freeman
 Introduction to the Practice of StatisticsStatisticsISBN:9781319013387Author:David S. Moore, George P. McCabe, Bruce A. CraigPublisher:W. H. Freeman