
Concept explainers
Videos
(a)
To make a
(a)
Explanation of Solution
The scatterplot with HbA as the explanatory variable is as:
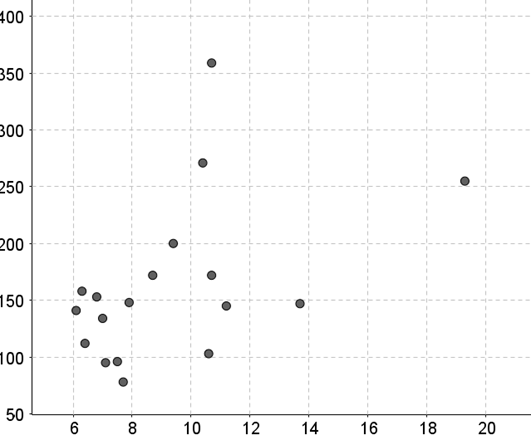
From the scatterplot we can say that, the scatterplot confirms a positive linear relationship, because the scatterplot slopes upwards. The scatterplot confirms a weak relationship, because the points seem to lie far apart.
(b)
To explain what effect do you think this subject has on the
(b)
Answer to Problem 69E
No, they do not affect.
Explanation of Solution
Now, we have to calculate the correlation by using the excel
First we will put the data in the excel file and then we will use the function for the correlation, that is,
CORREL function returns the
AVERAGE function returns the average of the
For the case with outlier:
Thus, the calculation will be as:
| Correlation | =CORREL(H1:H18,I1:I18) |
And the result will be as:
| Correlation | 0.4506 |
Thus, the slope will be,
And the y intercept will be,
The regression line will be as:
For the case without outlier:
Thus, the calculation will be as:
| Correlation | =CORREL(H1:H17,I1:I17) |
And the result will be as:
| Correlation | 0.3837 |
Thus, the slope will be,
And the y intercept will be,
The regression line will be as:
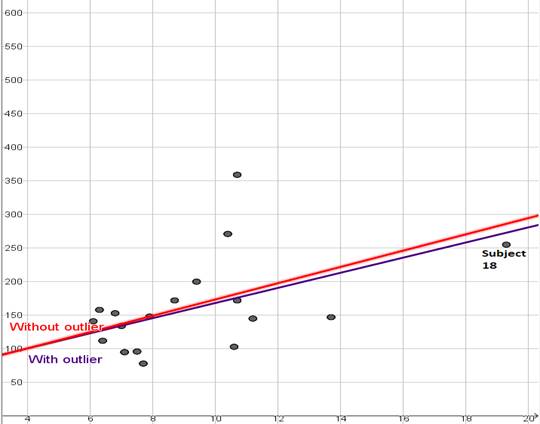
Thus, we note that the correlation coefficient with the outlier is more than the correlation coefficient without outlier. We then note that the outlier increases the correlation due to the fact that subject
(c)
To explain what effect do you think this subject has on the correlation and on the equation of the least squares regression line and calculate the correlation and equation of the least squares regression line with and without this subject to confirm your answer.
(c)
Answer to Problem 69E
It makes the regression line steeper.
Explanation of Solution
Now, we have to calculate the correlation by using the excel function as:
First we will put the data in the excel file and then we will use the function for the correlation, that is,
CORREL function returns the correlation coefficient of the
AVERAGE function returns the average of the
For the case with outlier:
Thus, the calculation will be as:
| Correlation | =CORREL(H1:H18,I1:I18) |
And the result will be as:
| Correlation | 0.4506 |
Thus, the slope will be,
And the y intercept will be,
The regression line will be as:
For the case without outlier:
Thus, the calculation will be as:
| Correlation | =CORREL(H1:H17,I1:I17) |
And the result will be as:
| Correlation | 0.5684 |
Thus, the slope will be,
And the y intercept will be,
The regression line will be as:
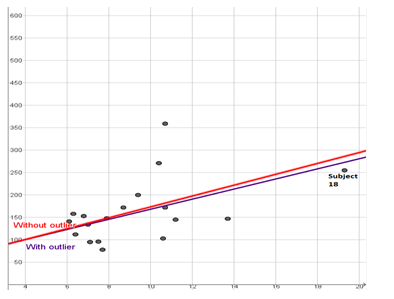
Thus, we note that the correlation coefficient with the outlier is less than the correlation coefficient without outlier. We then note that the outlier decreases the correlation due to the fact that subject
Chapter 3 Solutions
PRACTICE OF STATISTICS F/AP EXAM
Additional Math Textbook Solutions
Introductory Statistics
Essentials of Statistics (6th Edition)
Elementary Statistics: Picturing the World (7th Edition)
Elementary Statistics
Statistics for Business and Economics (13th Edition)
An Introduction to Mathematical Statistics and Its Applications (6th Edition)


 MATLAB: An Introduction with ApplicationsStatisticsISBN:9781119256830Author:Amos GilatPublisher:John Wiley & Sons Inc
 Probability and Statistics for Engineering and th...StatisticsISBN:9781305251809Author:Jay L. DevorePublisher:Cengage Learning
 Statistics for The Behavioral Sciences (MindTap C...StatisticsISBN:9781305504912Author:Frederick J Gravetter, Larry B. WallnauPublisher:Cengage Learning
 Elementary Statistics: Picturing the World (7th E...StatisticsISBN:9780134683416Author:Ron Larson, Betsy FarberPublisher:PEARSON
 The Basic Practice of StatisticsStatisticsISBN:9781319042578Author:David S. Moore, William I. Notz, Michael A. FlignerPublisher:W. H. Freeman
 Introduction to the Practice of StatisticsStatisticsISBN:9781319013387Author:David S. Moore, George P. McCabe, Bruce A. CraigPublisher:W. H. Freeman