
Concept explainers
Videos
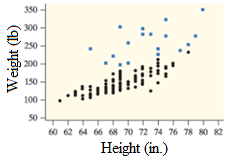
Similarities and differences in relationship between height and weight for two groups of athletes.
Answer to Problem 11E
Similarities:
Linear and positive association between height and weight for both groups, and neither group seems to have outliers.
Differences:
Weaker relationship between height and weight for athletes in the discus throw, hammers throw and shot put.
Weights in athletes like discus throw, hammers throw and short put should be higher in comparison to other athletes.
Explanation of Solution
Given information:
In Blue: Athletes from shot put, discus throw, hammers throw
In Black: Other track and field athletes
Similarities:
Note that
In the
And
No strong curvature exists in the points of either group; the association seems to be linear for both the groups.
Also,
Since there is no strong deviation of points from the pattern in the other points, neither group seems to have outliers.
Differences:
Note that
In the scatterplot, since the squares are spread further seem compared to the dots, there seems to be weaker relationship between height and weight for the athletes like hammer throw, discus throw and shot put.
Also,
In the scatterplot, since most of the squares lie above the dots, the weight of athletes in the hammer throw, discus throw and shot put seems to be higher than the weight of other athletes.
Chapter 3 Solutions
PRACTICE OF STATISTICS F/AP EXAM
Additional Math Textbook Solutions
Essentials of Statistics (6th Edition)
Elementary Statistics
Introductory Statistics
Statistics: The Art and Science of Learning from Data (4th Edition)
Statistics for Business and Economics (13th Edition)


 MATLAB: An Introduction with ApplicationsStatisticsISBN:9781119256830Author:Amos GilatPublisher:John Wiley & Sons Inc
 Probability and Statistics for Engineering and th...StatisticsISBN:9781305251809Author:Jay L. DevorePublisher:Cengage Learning
 Statistics for The Behavioral Sciences (MindTap C...StatisticsISBN:9781305504912Author:Frederick J Gravetter, Larry B. WallnauPublisher:Cengage Learning
 Elementary Statistics: Picturing the World (7th E...StatisticsISBN:9780134683416Author:Ron Larson, Betsy FarberPublisher:PEARSON
 The Basic Practice of StatisticsStatisticsISBN:9781319042578Author:David S. Moore, William I. Notz, Michael A. FlignerPublisher:W. H. Freeman
 Introduction to the Practice of StatisticsStatisticsISBN:9781319013387Author:David S. Moore, George P. McCabe, Bruce A. CraigPublisher:W. H. Freeman