
Videos
(a)
To make a
(a)
Explanation of Solution
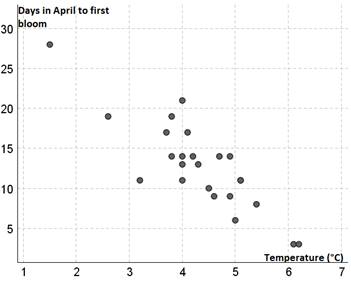
Since we expect the temperature to influence the days in April to first blossom temperature is the explanatory variable and the days in April to first blossom is the response variable. Thus, the scatterplot is as:
(b)
To use the technology to calculate the
(b)
Answer to Problem R3.4RE
Explanation of Solution
Using calculator, press on STAT and then select
Next, press on STAT select CALC and then select
Finally, pressing on ENTER then gives us the following result:
This then implies the regression line as:
This then implies that on average, the days in April to first blossom decreases by
(c)
To explain would you be willing to use the equation in part (b) to predict the date of the first blossom.
(c)
Answer to Problem R3.4RE
No.
Explanation of Solution
The regression line in part (b) is:
To predict the date to first blossom at
We then note that the predicted day to first blossom in April is
(d)
To calculate and interpret the residual for the year when the average March temperature was
(d)
Answer to Problem R3.4RE
Residual is
Explanation of Solution
The regression line in part (b) is:
Now, the days to first blossom when average March temperature was
And the actual value is
Thus, the residual is as:
This then implies that we overestimated the number of days in April to first blossom by
(e)
To use the technology to help construct the residual plot and describe what you see.
(e)
Explanation of Solution
The residual plot is as:
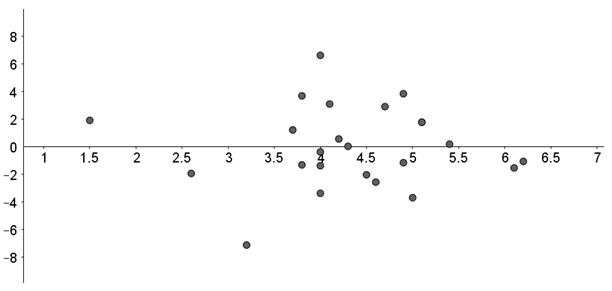
Thus, there is no obvious pattern in the residual plot and thus the linear regression line seems to be a good fit.
Chapter 3 Solutions
PRACTICE OF STATISTICS F/AP EXAM
Additional Math Textbook Solutions
College Algebra (7th Edition)
Elementary Statistics (13th Edition)
Pre-Algebra Student Edition
University Calculus: Early Transcendentals (4th Edition)
Calculus: Early Transcendentals (2nd Edition)


 MATLAB: An Introduction with ApplicationsStatisticsISBN:9781119256830Author:Amos GilatPublisher:John Wiley & Sons Inc
 Probability and Statistics for Engineering and th...StatisticsISBN:9781305251809Author:Jay L. DevorePublisher:Cengage Learning
 Statistics for The Behavioral Sciences (MindTap C...StatisticsISBN:9781305504912Author:Frederick J Gravetter, Larry B. WallnauPublisher:Cengage Learning
 Elementary Statistics: Picturing the World (7th E...StatisticsISBN:9780134683416Author:Ron Larson, Betsy FarberPublisher:PEARSON
 The Basic Practice of StatisticsStatisticsISBN:9781319042578Author:David S. Moore, William I. Notz, Michael A. FlignerPublisher:W. H. Freeman
 Introduction to the Practice of StatisticsStatisticsISBN:9781319013387Author:David S. Moore, George P. McCabe, Bruce A. CraigPublisher:W. H. Freeman