
Concept explainers
Videos
(a)
Interpretation of
(a)
Answer to Problem 20E
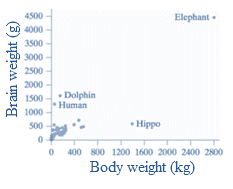
There is fairly strong and positive association between body weight (in kg) and brain weight (in g).
Explanation of Solution
Given information:
Correlation,

When r is positive,
When r is negative,
For weak correlation,
For moderate correlation,
For strong correlation,
Note that
The association between body weight in kilograms and brain weight in grams is strong and positive association.
(b)
Effect of human on the correlation.
(b)
Answer to Problem 20E
The
Explanation of Solution
Given information:
Correlation,
Note that
In the
Thus,
The humans have a higher brain weight relative to their body weight in comparison with other mammals.
Also,
The amount of linearity in the data gets decreased due to its deviation from the linear pattern.
We also know
The amount of linearity between the variables is measured by the correlation.
Hence,
Due to decrease in linearity, the correlation coefficient r would also decrease.
Chapter 3 Solutions
PRACTICE OF STATISTICS F/AP EXAM
Additional Math Textbook Solutions
STATS:DATA+MODELS-W/DVD
Elementary Statistics Using Excel (6th Edition)
Statistics for Psychology
Introductory Statistics
Intro Stats, Books a la Carte Edition (5th Edition)


 MATLAB: An Introduction with ApplicationsStatisticsISBN:9781119256830Author:Amos GilatPublisher:John Wiley & Sons Inc
 Probability and Statistics for Engineering and th...StatisticsISBN:9781305251809Author:Jay L. DevorePublisher:Cengage Learning
 Statistics for The Behavioral Sciences (MindTap C...StatisticsISBN:9781305504912Author:Frederick J Gravetter, Larry B. WallnauPublisher:Cengage Learning
 Elementary Statistics: Picturing the World (7th E...StatisticsISBN:9780134683416Author:Ron Larson, Betsy FarberPublisher:PEARSON
 The Basic Practice of StatisticsStatisticsISBN:9781319042578Author:David S. Moore, William I. Notz, Michael A. FlignerPublisher:W. H. Freeman
 Introduction to the Practice of StatisticsStatisticsISBN:9781319013387Author:David S. Moore, George P. McCabe, Bruce A. CraigPublisher:W. H. Freeman