
Videos
Histogram to display the distribution of weight and discuss the distribution.
Answer to Problem 35E
The distribution is skewed to right, spread from 0 to 35, with center at 2.5 and without outliers.
Explanation of Solution
Given information:
Data representing population of diamonds formed in a single
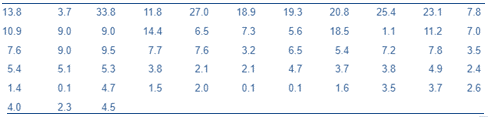
Frequency table:
Find the frequency for each interval that is the number of data values falling within each interval.
The first value of the first interval is 0, having width of 5.
Thus,
The first interval is 0 − <5.
The interval follows
5 − <10, 10 − <15 etc.
The intervals will be established until exactly one interval is allocated to all the data values.
| Intervals | Frequency |
| 0 – <5
5 – <10 10 – <15 15 – <20 20 – <25 25 – <30 30 – <35 | 26
9 5 3 2 2 1 |
Frequency Histogram:
The bars need to be bounded by interval boundaries and width of each bar should be the same.
Whereas, the height needs to be equal to the frequency.
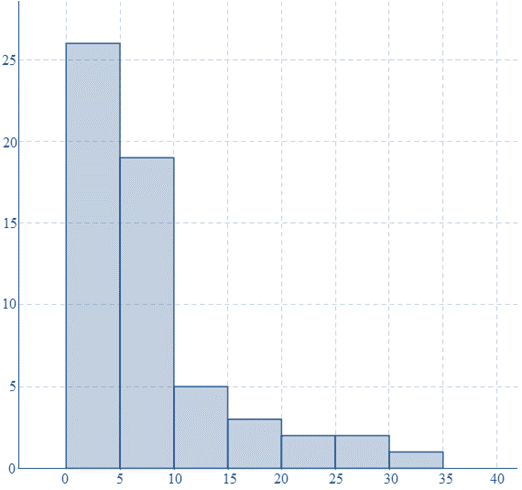
Spread: The weight appears to
Shape: In the histogram, since the highest bars are to the left along with a tail of smaller balls to the right. Thus, the shape will be skewed to right.
Outliers: Since the histogram does not have gaps, no outliers exist.
Center: Since it is the middle of highest bar, center of the distribution roughly appears to be at 2.5.
Chapter 3 Solutions
PRACTICE OF STATISTICS F/AP EXAM
Additional Math Textbook Solutions
Essentials of Statistics (6th Edition)
Basic Business Statistics, Student Value Edition (13th Edition)
Essentials of Statistics, Books a la Carte Edition (5th Edition)
Introductory Statistics
STATS:DATA+MODELS-W/DVD
Basic Business Statistics, Student Value Edition


 MATLAB: An Introduction with ApplicationsStatisticsISBN:9781119256830Author:Amos GilatPublisher:John Wiley & Sons Inc
 Probability and Statistics for Engineering and th...StatisticsISBN:9781305251809Author:Jay L. DevorePublisher:Cengage Learning
 Statistics for The Behavioral Sciences (MindTap C...StatisticsISBN:9781305504912Author:Frederick J Gravetter, Larry B. WallnauPublisher:Cengage Learning
 Elementary Statistics: Picturing the World (7th E...StatisticsISBN:9780134683416Author:Ron Larson, Betsy FarberPublisher:PEARSON
 The Basic Practice of StatisticsStatisticsISBN:9781319042578Author:David S. Moore, William I. Notz, Michael A. FlignerPublisher:W. H. Freeman
 Introduction to the Practice of StatisticsStatisticsISBN:9781319013387Author:David S. Moore, George P. McCabe, Bruce A. CraigPublisher:W. H. Freeman