
Concept explainers
Videos
(a)
Interpretation of
(a)
Answer to Problem 19E
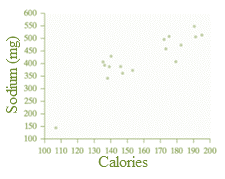
There is fairly strong and positive association between the calories and sodium in 17 brands of meat hot dogs.
Explanation of Solution
Given information:
Correlation,
When r is positive,
When r is negative,
For weak correlation,
For moderate correlation,
For strong correlation,
Note that
The association between the calories and sodium in 17 brands of meat hot dogs is strong and positive association.
(b)
Effect of hot dog brand with the smallest calorie content on the correlation.
(b)
Answer to Problem 19E
The
Explanation of Solution
Given information:
Correlation,

Note that
In the
Thus,
The removal of this point from the data set makes the data appear more linear.
Hence,
There will be increase in linear
Chapter 3 Solutions
PRACTICE OF STATISTICS F/AP EXAM
Additional Math Textbook Solutions
Elementary Statistics
Introductory Statistics
Statistics for Business and Economics (13th Edition)
Statistical Reasoning for Everyday Life (5th Edition)
Elementary Statistics: Picturing the World (6th Edition)


 MATLAB: An Introduction with ApplicationsStatisticsISBN:9781119256830Author:Amos GilatPublisher:John Wiley & Sons Inc
 Probability and Statistics for Engineering and th...StatisticsISBN:9781305251809Author:Jay L. DevorePublisher:Cengage Learning
 Statistics for The Behavioral Sciences (MindTap C...StatisticsISBN:9781305504912Author:Frederick J Gravetter, Larry B. WallnauPublisher:Cengage Learning
 Elementary Statistics: Picturing the World (7th E...StatisticsISBN:9780134683416Author:Ron Larson, Betsy FarberPublisher:PEARSON
 The Basic Practice of StatisticsStatisticsISBN:9781319042578Author:David S. Moore, William I. Notz, Michael A. FlignerPublisher:W. H. Freeman
 Introduction to the Practice of StatisticsStatisticsISBN:9781319013387Author:David S. Moore, George P. McCabe, Bruce A. CraigPublisher:W. H. Freeman