Genetic Analysis: An Integrated Approach (3rd Edition)
3rd Edition
ISBN: 9780134605173
Author: Mark F. Sanders, John L. Bowman
Publisher: PEARSON
expand_more
expand_more
format_list_bulleted
Concept explainers
Videos
Textbook Question
Chapter 19, Problem 24P
Cattle breeders would like to improve the protein content and butterfat content of milk produced by a herd of cows. Narrow sense heritability values are
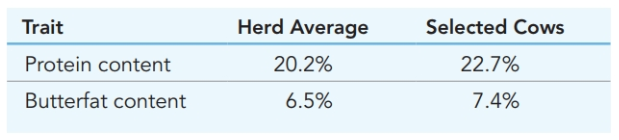
a. Determine the selection differential (S) for each trait in this herd.
b. Which trait is likely to be the most responsive to artificial selection applied by the cattle breeders through selection of cows for mating?
Expert Solution & Answer
Want to see the full answer?
Check out a sample textbook solution
Students have asked these similar questions
1) The following variances were calculated for two traits in a herd of hogs.
Trait
Vp
VG
VA
Back fat
30.6
12.2
8.44
Body length
52.4
26.4
11.70
Calculate the broad sense heritability (H?) and narrow sense heritability's (h2) for each train in this herd.
Which of the two traits will respond best to the selection by a breeder? Why?
In the following table, average differences of birth height, birth weight, and IQ score
between monozygotic twins (reared together and apart are compared. Based on the
data below, which quantitative trait has the lowest heritability?
Trait
Height
(cm)
Weight
(kg)
IQ
Height
Weight
O1Q
MZ
Reared
Together
Trait
Tail length
0.7
1.9
The following variances were calculated for two traits in poodles.
VA
MZ
Reared
Apart
6.3
Body length 11.7
4.5
1.9
Vp
20.1
33.4
Ve
16.2
Calculate broad sense (H²) and narrow sense (h²) heritability for each trait in this
herd.
4
The following variances were calculated for two traits in poodles.
Vp
VG
20.1
8
Trait
Tail length
Body
length
VA
6.3
11.7
33.4
16.2
Calculate broad sense (H²) and narrow sense (h²) heritability for each trait
in this herd.
Chapter 19 Solutions
Genetic Analysis: An Integrated Approach (3rd Edition)
Ch. 19 - Which of the following traits would you expect to...Ch. 19 - 19.2 For the traits listed in the previous...Ch. 19 - Compare and contrast broad sense heritability and...Ch. 19 - 19.4 In a cross of two pure-breeding lines of...Ch. 19 - 19.5 Describe the difference between continuous...Ch. 19 - Prob. 6PCh. 19 - 19.7 Provide a definition and an example for each...Ch. 19 - 19.8 What is a random sample, and why can a random...Ch. 19 - 19.9 Why is heritability an important phenomenon...Ch. 19 - 19.10 Three pairs of genes with two alleles each (...
Ch. 19 - 19.11 In selective breeding experiments, it is...Ch. 19 - 19.12 Two inbred lines of sunflowers produce...Ch. 19 - What is quantitative trait locus (QTL)? Suppose...Ch. 19 - 19.14 In Nicotiana, two inbred strains produce...Ch. 19 - 19.15 Suppose the length of maize ears has narrow...Ch. 19 - In a line of cherry tomatoes, the average fruit...Ch. 19 - 19.17 Two purebreeding wheat strains, one...Ch. 19 - Prob. 18PCh. 19 - During a visit with your grandparents, they...Ch. 19 - 19.20 An association of racehorse owners is...Ch. 19 - Prob. 21PCh. 19 - Suppose a polygenic system for producing color in...Ch. 19 - New Zealand lamb breeders measure the following...Ch. 19 - Cattle breeders would like to improve the protein...Ch. 19 - In human gestational development, abnormalities of...Ch. 19 - The children of couples in which one partner has...Ch. 19 - Answer the following in regard to multifactorial...Ch. 19 - 19.28 Suppose the mature height of a plant is a...Ch. 19 - A three-gene system of additive genes (A, B, and...Ch. 19 - 19.30 Congenital dislocation of the hip is a...Ch. 19 - A total of 20 men and 20 women volunteer to...
Knowledge Booster


Learn more about
Need a deep-dive on the concept behind this application? Look no further. Learn more about this topic, biology and related others by exploring similar questions and additional content below.Similar questions
- In a herd of dairy cows the narrow-sense heritability for milk protein content is 0.76, and for milk butterfat it is 0.82. The correlation coefficient between milk protein content and butterfat is 0.91. If the farmer selects for cows producing more butterfat in their milk, what will be the most likely effect on milk protein content in the next generation?arrow_forward2) The following variances were calculated for two traits in poodles. Trait VA Vp VG Tail length 6.3 20.1 8 Body length 11.7 33.4 16.2 Calculate broad sense (H?) and narrow sense (h?) heritability for each trait in this herd.arrow_forwardIn a horse population, three different traits showing continuous distribution were measured,and their variances are shown in the table below:(see image) 1. Calculate the broad sense and narrow sense heritabilities for each trait.2. In the population of animals studied, which trait would respond best to selection for breeding purposes? Explain your answer.arrow_forward
- The mean and variance of plant height of two highly inbred strains (P1 and P2) and their progeny (F1 and F2) are shown here. Strain Mean (cm) Variance P1 34.2 4.2 P2 55.3 3.8 F1 44.2 5.6 F2 46.3 10.3 Calculate the broad-sense heritability (H2) of plant height in this species.arrow_forwardThree characteristics in beef cattle—body weight, fat content, and tenderness—are measured, and the following variance components are estimated: Body weight Fat content Tenderness VA 22 45 12 VD 10 25 5 VI 3 8 2 VE 42 64 8 VGE 0 0 1 In this population, which characteristic would respond best to selection? Explain your reasoning.arrow_forwardYou estimate the heritability of milk production in the brown cows at your friend’s farm. The heritability is H2=0.45. Identify the following that best describes the conclusions you can make from your study. a. Cows that produce milk at lower rates than at your friend’s farm occurs because they have bad genes. b. Cow milk production in this population is dependent on both environmental and genetic influence. c. Milk production is not heritable in your friend’s population of cows. d. Milk production heritability at the farm 15 miles down the road is also likely to be 0.45.arrow_forward
- In a horse population, three different traits showing continuous distribution were measures, and their variances are shown in the table below: Calculate the broad sense and narrow sense heritabilities for each trait.arrow_forwardVariance in back fat & body length were calculated in a heard of hogs and summarized in the table below. Trait In hogs Back fat Body length Vp 24.5 48.2 VG 15.5 28.4 VA 7.0 12.6 Calculate the narrow-sense heritability for body length, and provide an answer with 2 places behind the decimal. [h²] (Enter an answer with 2 or 3 significant figures)arrow_forwardTwo loci contribute to eyelash length in angora rabbits (locus A and B). Assuming additive genetic variance and disregarding environmental effects, you determine that the following alleles contribute the following values to the total expression of lash length (in cm) A = 2.3, a=1.5, B=2.4, b=1.7 What would the phenotype of a rabbit with a genotype of AABb be? _________cmarrow_forward
- Why is the narrow-sense heritability more useful to plant and animal breeders than broad sense heritability?arrow_forwardIn the following table, average differences of birth height, birth weight, and IQ score between monozygotic twins (reared together and apart are compared. Based on the data below, which quantitative trait has the lowest heritability? Trait Height (cm) Weight (kg) IQ Height Weight IQ MZ Reared Together 0.7 1.9 1.7 MZ Reared Apart 0.8 4.5 1.9arrow_forwardIn a population of 1,000 squirrels, 60 are melanistic. Agouti fur (each hair displays two or more bands of pigmentation) is dominant over melanistic fur (excess of pigmentation that leads to a dark, often almost black fur). How often is agouti fur expressed? 0.25 0.75 0.9375 0.06arrow_forward
arrow_back_ios
SEE MORE QUESTIONS
arrow_forward_ios
Recommended textbooks for you
 Human Anatomy & Physiology (11th Edition)BiologyISBN:9780134580999Author:Elaine N. Marieb, Katja N. HoehnPublisher:PEARSON
 Biology 2eBiologyISBN:9781947172517Author:Matthew Douglas, Jung Choi, Mary Ann ClarkPublisher:OpenStax
 Anatomy & PhysiologyBiologyISBN:9781259398629Author:McKinley, Michael P., O'loughlin, Valerie Dean, Bidle, Theresa StouterPublisher:Mcgraw Hill Education,
 Molecular Biology of the Cell (Sixth Edition)BiologyISBN:9780815344322Author:Bruce Alberts, Alexander D. Johnson, Julian Lewis, David Morgan, Martin Raff, Keith Roberts, Peter WalterPublisher:W. W. Norton & Company
 Laboratory Manual For Human Anatomy & PhysiologyBiologyISBN:9781260159363Author:Martin, Terry R., Prentice-craver, CynthiaPublisher:McGraw-Hill Publishing Co.
 Inquiry Into Life (16th Edition)BiologyISBN:9781260231700Author:Sylvia S. Mader, Michael WindelspechtPublisher:McGraw Hill Education
Human Anatomy & Physiology (11th Edition)
Biology
ISBN:9780134580999
Author:Elaine N. Marieb, Katja N. Hoehn
Publisher:PEARSON
Biology 2e
Biology
ISBN:9781947172517
Author:Matthew Douglas, Jung Choi, Mary Ann Clark
Publisher:OpenStax
Anatomy & Physiology
Biology
ISBN:9781259398629
Author:McKinley, Michael P., O'loughlin, Valerie Dean, Bidle, Theresa Stouter
Publisher:Mcgraw Hill Education,
Molecular Biology of the Cell (Sixth Edition)
Biology
ISBN:9780815344322
Author:Bruce Alberts, Alexander D. Johnson, Julian Lewis, David Morgan, Martin Raff, Keith Roberts, Peter Walter
Publisher:W. W. Norton & Company
Laboratory Manual For Human Anatomy & Physiology
Biology
ISBN:9781260159363
Author:Martin, Terry R., Prentice-craver, Cynthia
Publisher:McGraw-Hill Publishing Co.
Inquiry Into Life (16th Edition)
Biology
ISBN:9781260231700
Author:Sylvia S. Mader, Michael Windelspecht
Publisher:McGraw Hill Education
Genetic Variation and Mutation | 9-1 GCSE Science Biology | OCR, AQA, Edexcel; Author: SnapRevise;https://www.youtube.com/watch?v=bLP8udGGfHU;License: Standard YouTube License, CC-BY