
Introduction To Statistics And Data Analysis
6th Edition
ISBN: 9781337793612
Author: PECK, Roxy.
Publisher: Cengage Learning,
expand_more
expand_more
format_list_bulleted
Concept explainers
Videos
Textbook Question
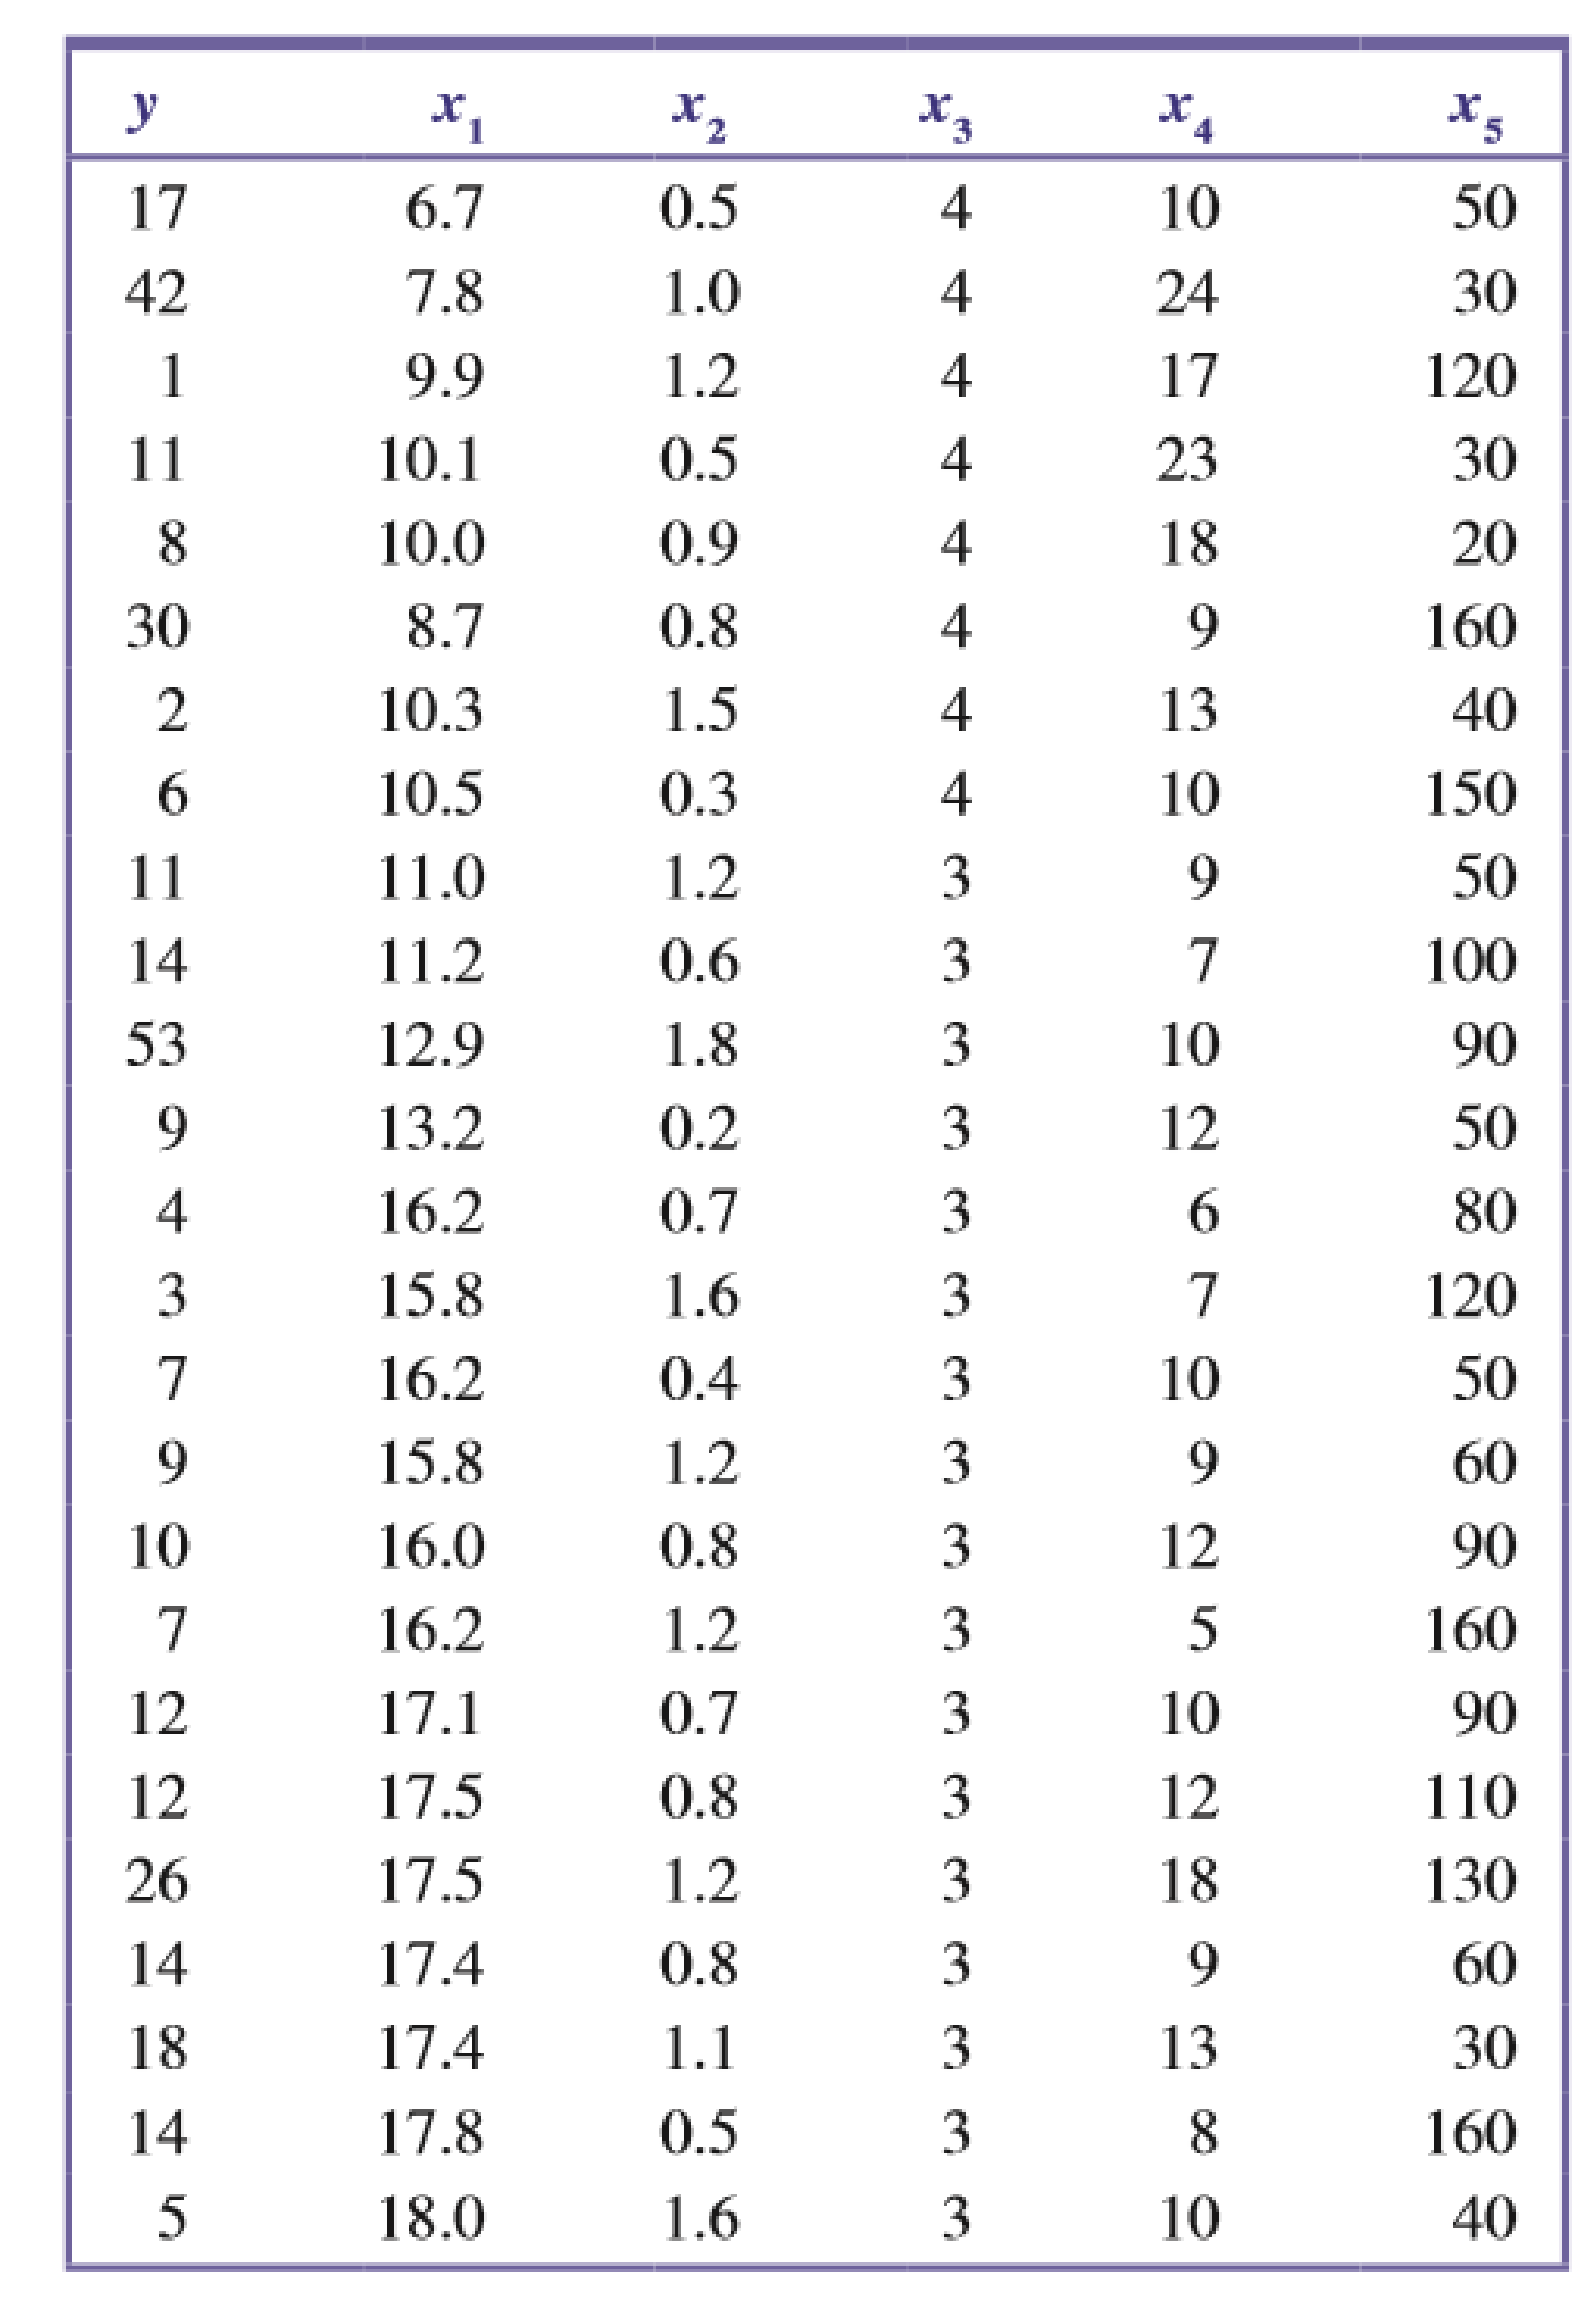
Chapter 14.4, Problem 61E
This exercise requires use of a statistical software package. The accompanying n = 25 observations on y = Catch at intake (number of fish), x1 = Water temperature (°C), x2 = Minimum tide height (m), x3 = Number of pumps running, x4 = Speed (knots), and x5 = Wind-
Expert Solution & Answer

Trending nowThis is a popular solution!

Students have asked these similar questions
The administration of a midwestern university commissioned a salary equity study to help establish benchmarks for faculty salaries. The administration utilized the following regression model for annual salary, y : ?(?) β0+β1x ,where ?=0 if lecturer, 1 if assistant professor, 2 if associate professor, and 3 if full professor. The administration wanted to use the model to compare the mean salaries of professors in the different ranks.
a) Explain the flaw in the model.
b)Propose an alternative model that will achieve the administration’s objective.
c) If the global F-test for the model you proposed in 2 is conducted, what would be the value of the numerator degrees of freedom?
A researcher interested in explaining the level of foreign reserves for the country of
Barbados estimated the following multiple regression model using yearly data
spanning the period 2001 to 2016:
FR=a+BOIL+yEXP+8FDI
Where FR = yearly foreign reserves ($000's), OIL = annual oil prices, EXP =
yearly total exports ($000's) and FDI = annual foreign direct investment ($000's).
The sample of data was processed using MINITAB and the following is an extract
of the output obtained:
Predictor
Сoef
StDev
t-ratio
p-value
Constant
5491.38
2508.81
2.1888
0.0491
OIL
85.39
18.46
4.626
0.0006
EXP
-377.08
112.19
0.0057
FDI
-396.99
160.66
-2.471
**
S = 2.45
R-sq
96.3%
R-sq (adj)
95.3%
Analysis of Variance
Source
DF
MS
F
Regression
1991.31
663.77
??
Error
12
77.4
6.45
Total
15
a) What is dependent and independent variables?
b) Fully write out the regression equation
c) Fill in the missing values *', ***', '?'and ??'
d) Hence test whether B is significant. Give reasons for your answer.
e) Perform the F…
A clothing manufacturer wants to estimate the amount of scrap cloth generated each day by its fabric cutting machines. Eight potential
independent variables have been identified. These include the following.
= amount of cloth run through cutting machines (in square feet)
X2
= machine cutting speed (in feet per minute)
age of machine (in years)
The manufacturer selects 6 of the candidate independent variables to use in a multiple regression model for estimating y, the amount of scrap
cloth (in square feet). Using data collected from 24 different cutting machines operating on different days, the model
y = Bo+B1*1
+B,x2+
+ Bax, is fit to the data. Fill in the blanks in the analysis of variance (ANOVA) table associated with this model. Do all
...
calculations to at least three decimal places.
Chapter 14 Solutions
Introduction To Statistics And Data Analysis
Ch. 14.1 - Prob. 1ECh. 14.1 - The authors of the paper Weight-Bearing Activity...Ch. 14.1 - Prob. 3ECh. 14.1 - Prob. 4ECh. 14.1 - Prob. 5ECh. 14.1 - Prob. 6ECh. 14.1 - Prob. 7ECh. 14.1 - Prob. 8ECh. 14.1 - Prob. 9ECh. 14.1 - The relationship between yield of maize (a type of...
Ch. 14.1 - Prob. 11ECh. 14.1 - A manufacturer of wood stoves collected data on y...Ch. 14.1 - Prob. 13ECh. 14.1 - Prob. 14ECh. 14.1 - Prob. 15ECh. 14.2 - Prob. 16ECh. 14.2 - State as much information as you can about the...Ch. 14.2 - Prob. 18ECh. 14.2 - Prob. 19ECh. 14.2 - Prob. 20ECh. 14.2 - The ability of ecologists to identify regions of...Ch. 14.2 - Prob. 22ECh. 14.2 - Prob. 23ECh. 14.2 - Prob. 24ECh. 14.2 - Prob. 25ECh. 14.2 - Prob. 26ECh. 14.2 - This exercise requires the use of a statistical...Ch. 14.2 - Prob. 28ECh. 14.2 - The article The Undrained Strength of Some Thawed...Ch. 14.2 - Prob. 30ECh. 14.2 - Prob. 31ECh. 14.2 - Prob. 32ECh. 14.2 - Prob. 33ECh. 14.2 - This exercise requires the use of a statistical...Ch. 14.2 - This exercise requires the use of a statistical...Ch. 14.3 - Prob. 36ECh. 14.3 - Prob. 37ECh. 14.3 - When Coastal power stations take in large amounts...Ch. 14.3 - Prob. 39ECh. 14.3 - The article first introduced in Exercise 14.28 of...Ch. 14.3 - Data from a random sample of 107 students taking a...Ch. 14.3 - Benevolence payments are monies collected by a...Ch. 14.3 - Prob. 43ECh. 14.3 - Prob. 44ECh. 14.3 - Prob. 45ECh. 14.3 - Prob. 46ECh. 14.3 - Exercise 14.26 gave data on fish weight, length,...Ch. 14.3 - Prob. 48ECh. 14.3 - Prob. 49ECh. 14.3 - Prob. 50ECh. 14.4 - Prob. 51ECh. 14.4 - Prob. 52ECh. 14.4 - The article The Analysis and Selection of...Ch. 14.4 - Prob. 54ECh. 14.4 - Prob. 55ECh. 14.4 - Prob. 57ECh. 14.4 - Prob. 58ECh. 14.4 - Prob. 59ECh. 14.4 - Prob. 60ECh. 14.4 - This exercise requires use of a statistical...Ch. 14.4 - Prob. 62ECh. 14 - Prob. 63CRCh. 14 - Prob. 64CRCh. 14 - The accompanying data on y = Glucose concentration...Ch. 14 - Much interest in management circles has focused on...Ch. 14 - Prob. 67CRCh. 14 - Prob. 68CRCh. 14 - Prob. 69CRCh. 14 - A study of pregnant grey seals resulted in n = 25...Ch. 14 - Prob. 71CRCh. 14 - Prob. 72CRCh. 14 - This exercise requires the use of a statistical...
Knowledge Booster


Learn more about
Need a deep-dive on the concept behind this application? Look no further. Learn more about this topic, statistics and related others by exploring similar questions and additional content below.Similar questions
- If your graphing calculator is capable of computing a least-squares sinusoidal regression model, use it to find a second model for the data. Graph this new equation along with your first model. How do they compare?arrow_forwardFind the equation of the regression line for the following data set. x 1 2 3 y 0 3 4arrow_forward3. Wine Participant magazine has collected average price per bottle for the prestigious Chateau Le Thundebird bordeaux for different vintages (years). The data appears in the table below. year of bottling price a) draw the scatter diagram showing how wine price varies by vintage year b) use the most appropriate regression equation to determine the relationship between year of bottling (age) and price. c) what is the explanatory power (RSQ) of that equation d) determine the predicted price of a bottle of this wine for the 2017 vintage. 2009 36 2010 40 2011 51 2012 60 2013 68 2014 72 2015 70 2016 65 2018 51 2019 44 2020 39arrow_forward
- An agribusiness performed a regression of wheat yield (bushels per acre) using observations on 21 test plots with four predictors (rainfall, fertilizer, soil acidity, hours of sun). The standard error was 1.02 bushels.arrow_forwardA researcher interested in explaining the level of foreign reserves for the country of Barbados estimated the following multiple regression model using yearly data spanning the period 2001 to 2016: FR=a+BOIL+YEXP+8FDI Where FR = yearly foreign reserves ($000's), OIL = annual oil prices, EXP = yearly total exports (S000's) and FDI = annual foreign direct investment (S000's). The sample of data was processed using MINITAB and the following is an extract of the output obtained: Predictor Coef StDev t-ratio p-value Constant 5491.38 2508.81 2.1888 0.0491 OIL 85.39 18.46 4.626 0.0006 ЕXP -377.08 112.19 0.0057 FDI -396.99 160.66 -2.471 ** s = 2.45 R-sq = 96.3% R-sq (adj) = 95.3% Analysis of Variance Source DF MS Regression 1991.31 663.77 ?? Error 12 77.4 6.45 Total 15arrow_forwardA researcher interested in explaining the level of foreign reserves for the country of Barbadosestimated the following multiple regression model using yearly data spanning the period 2001 to 2016: ??=?+????+????+????Where FR = yearly foreign reserves ($000’s), OIL = annual oil prices, EXP = yearly total exports ($000’s) and FDI = annual foreign direct investment ($000’s). The sample of data was processed using MINITAB and the following is an extract of the output obtained:Predictor Coef StDev t-ratio p-value Constant 5491.38 2508.81 2.1888 0.0491OIL 85.39 18.46 4.626 0.0006EXP -377.08 112.19 * 0.0057FDI -396.99 160.66 -2.471 ** S = 2.45 R-sq = 96.3% R-sq(adj) = 95.3%Analysis of VarianceSource DF SS MS F pRegression 3 1991.31 663.77 ? ??Error 12 77.4 6.45Total 15 Perform the F Test making sure to state the null and alternative hypothesis. f) Given an interpretation of the term “R-sq” and comment on its value.arrow_forward
- A researcher interested in explaining the level of foreign reserves for the country of Barbados estimated the following multiple regression model using yearly data spanning the period 2001 to 2016: FR=a+B01L+YEXP+8FDI Where FR = yearly foreign reserves (So000's), OIL = annual oil prices, EXP = yearly total exports (S000's) and FDI = annual foreign direct investment ($000's). The sample of data was processed using MINITAB and the following is an extract of the output obtained: Predictor Coef StDev t-ratio p-value Constant 5491.38 2508.81 2.1888 0.0491 OIL 85.39 18.46 4.626 0.0006 EXP -377.08 112.19 0.0057 FDI -396.99 160.66 -2.471 s - 2.45 R-sq = 96.3% R-sq(adj) = 95.3% Analysis of Variance Source DF MS F Regression 3 1991.31 663.77 ?? Error 12 43. רר 6.45 Total 15 a) What is dependent and independent variables? b) Fully write out the regression equation c) Fill in the missing values **', **', '?'and *??"arrow_forwardA researcher interested in explaining the level of foreign reserves for the country of Barbadosestimated the following multiple regression model using yearly data spanning the period 2001 to 2016: ??=?+????+????+????Where FR = yearly foreign reserves ($000’s), OIL = annual oil prices, EXP = yearly total exports ($000’s) and FDI = annual foreign direct investment ($000’s). The sample of data was processed using MINITAB and the following is an extract of the output obtained:Predictor Coef StDev t-ratio p-value Constant 5491.38 2508.81 2.1888 0.0491OIL 85.39 18.46 4.626 0.0006EXP -377.08 112.19 * 0.0057FDI -396.99 160.66 -2.471 ** S = 2.45 R-sq = 96.3% R-sq(adj) = 95.3%Analysis of VarianceSource DF SS MS F pRegression 3 1991.31 663.77 ? ??Error 12 77.4 6.45Total 15a) What is dependent and independent variables? b) Fully write out the regression equation [1] c) Fill in the missing values ‘*’, ‘**’, ‘?’and ‘??’arrow_forwardFit these three regression models and then discuss the similarities and differences between them, particularly as relates to slope estimates (use CI’s) and R2. Also address why this is a “special case” and we wouldn’t necessarily expect to see these model characteristics for a typical dataset. a) Additive model including both predictors (output attached) b) Model including only Moisture (output attached) c) Model including only Sweetness BrandLiking = 68.62 + 4.38 Sweetness Term 95% CI P-ValueConstant (50.16, 87.09) 0.000Sweetness (-1.46, 10.21) 0.130 S R-sq R-sq(adj)10.8915 15.57% 9.54%arrow_forward
- A researcher interested in explaining the level of foreign reserves for the country of Barbadosestimated the following multiple regression model using yearly data spanning the period 2001 to 2016: ??=?+????+????+????Where FR = yearly foreign reserves ($000’s), OIL = annual oil prices, EXP = yearly total exports ($000’s) and FDI = annual foreign direct investment ($000’s). The sample of data was processed using MINITAB and the following is an extract of the output obtained:Predictor Coef StDev t-ratio p-value Constant 5491.38 2508.81 2.1888 0.0491OIL 85.39 18.46 4.626 0.0006EXP -377.08 112.19 * 0.0057FDI -396.99 160.66 -2.471 ** S = 2.45 R-sq = 96.3% R-sq(adj) = 95.3%Analysis of VarianceSource DF SS MS F pRegression 3 1991.31 663.77 ? ??Error 12 77.4 6.45Total 15a) What is dependent and independent variables? [2]b) Fully write out the regression equation [1] c) Fill in the missing values ‘*’, ‘**’, ‘?’and ‘??’ [4] d) Hence test whether ? is significant. Give reasons for your answer. [4]…arrow_forwardA researcher interested in explaining the level of foreign reserves for the country of Barbadosestimated the following multiple regression model using yearly data spanning the period 2001 to 2016: ??=?+????+????+????Where FR = yearly foreign reserves ($000’s), OIL = annual oil prices, EXP = yearly total exports ($000’s) and FDI = annual foreign direct investment ($000’s). The sample of data was processed using MINITAB and the following is an extract of the output obtained: Predictor Coef StDev t-ratio p-value Constant 5491.38 2508.81 2.1888 0.0491OIL 85.39 18.46 4.626 0.0006EXP -377.08 112.19 * 0.0057FDI -396.99 160.66 -2.471 ** S = 2.45 R-sq = 96.3% R-sq(adj) = 95.3% Analysis of VarianceSource DF SS MS F pRegression 3 1991.31…arrow_forward
arrow_back_ios
arrow_forward_ios
Recommended textbooks for you
 Calculus For The Life SciencesCalculusISBN:9780321964038Author:GREENWELL, Raymond N., RITCHEY, Nathan P., Lial, Margaret L.Publisher:Pearson Addison Wesley,
 Linear Algebra: A Modern IntroductionAlgebraISBN:9781285463247Author:David PoolePublisher:Cengage Learning
 College AlgebraAlgebraISBN:9781305115545Author:James Stewart, Lothar Redlin, Saleem WatsonPublisher:Cengage Learning
 Trigonometry (MindTap Course List)TrigonometryISBN:9781305652224Author:Charles P. McKeague, Mark D. TurnerPublisher:Cengage Learning
 Glencoe Algebra 1, Student Edition, 9780079039897...AlgebraISBN:9780079039897Author:CarterPublisher:McGraw Hill
 Functions and Change: A Modeling Approach to Coll...AlgebraISBN:9781337111348Author:Bruce Crauder, Benny Evans, Alan NoellPublisher:Cengage Learning
Calculus For The Life Sciences
Calculus
ISBN:9780321964038
Author:GREENWELL, Raymond N., RITCHEY, Nathan P., Lial, Margaret L.
Publisher:Pearson Addison Wesley,
Linear Algebra: A Modern Introduction
Algebra
ISBN:9781285463247
Author:David Poole
Publisher:Cengage Learning
College Algebra
Algebra
ISBN:9781305115545
Author:James Stewart, Lothar Redlin, Saleem Watson
Publisher:Cengage Learning
Trigonometry (MindTap Course List)
Trigonometry
ISBN:9781305652224
Author:Charles P. McKeague, Mark D. Turner
Publisher:Cengage Learning
Glencoe Algebra 1, Student Edition, 9780079039897...
Algebra
ISBN:9780079039897
Author:Carter
Publisher:McGraw Hill
Functions and Change: A Modeling Approach to Coll...
Algebra
ISBN:9781337111348
Author:Bruce Crauder, Benny Evans, Alan Noell
Publisher:Cengage Learning
Correlation Vs Regression: Difference Between them with definition & Comparison Chart; Author: Key Differences;https://www.youtube.com/watch?v=Ou2QGSJVd0U;License: Standard YouTube License, CC-BY
Correlation and Regression: Concepts with Illustrative examples; Author: LEARN & APPLY : Lean and Six Sigma;https://www.youtube.com/watch?v=xTpHD5WLuoA;License: Standard YouTube License, CC-BY