MATLAB: An Introduction with Applications
6th Edition
ISBN: 9781119256830
Author: Amos Gilat
Publisher: John Wiley & Sons Inc
expand_more
expand_more
format_list_bulleted
Question
- Fit these three regression models and then discuss the similarities and differences between them, particularly as relates to slope estimates (use CI’s) and R2. Also address why this is a “special case” and we wouldn’t necessarily expect to see these model characteristics for a typical dataset.
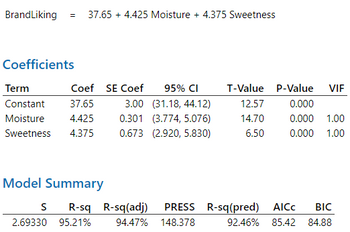
a) Additive model including both predictors (output attached)
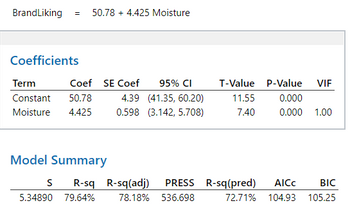
b) Model including only Moisture (output attached)
c) Model including only Sweetness
BrandLiking = 68.62 + 4.38 Sweetness
Term 95% CI P-Value
Constant (50.16, 87.09) 0.000
Sweetness (-1.46, 10.21) 0.130
S R-sq R-sq(adj)
10.8915 15.57% 9.54%

Transcribed Image Text:BrandLiking
= 37.65 + 4.425 Moisture + 4.375 Sweetness
Coefficients
Term
Coef SE Coef 95% CI
Constant
37.65
3.00 (31.18, 44.12)
Moisture 4.425 0.301 (3.774, 5.076)
Sweetness 4.375
0.673 (2.920, 5.830)
Model Summary
S R-sq R-sq(adj)
2.69330 95.21%
T-Value P-Value
12.57
0.000
14.70
0.000
1.00
6.50
0.000 1.00
94.47% 148.378
VIF
PRESS R-sq(pred) AICC BIC
92.46% 85.42 84.88

Transcribed Image Text:BrandLiking = 50.78 + 4.425 Moisture
Coefficients
Term
Coef SE Coef 95% CI
4.39 (41.35, 60.20)
Constant 50.78
Moisture 4.425 0.598 (3.142, 5.708)
Model Summary
T-Value P-Value VIF
11.55
0.000
7.40
0.000 1.00
S R-sq R-sq(adj) PRESS R-sq(pred)
5.34890 79.64% 78.18% 536.698
AICC
BIC
72.71% 104.93 105.25
Expert Solution
This question has been solved!
Explore an expertly crafted, step-by-step solution for a thorough understanding of key concepts.
Step by stepSolved in 2 steps with 3 images

Knowledge Booster
Similar questions
- If a regression line for two variables has a small positive slope, then the: variables are positively associated? variables are negatively associated? association of the variables cannot be determined. variables have no association with each other.arrow_forwardData on 220 reported crimes is collected from district X in 2016. Suppose CS denotes the total cost to the state of offering crime protection services to this district (in thousand dollars), LEOP denotes the number of law enforcement officers on patrol, DTP denotes the damage to public and private property (in thousand dollars), CCTV denotes the number of CCTV cameras installed in the district, and Prison denotes the number of prison inmates The following table shows the results of a few regressions of the total cost to the state. Dependent variable: total cost to the state (in thousand dollars) Regressor (1) (2) (3) (4) 12.32 17.99 14.55 18.1 LEOP (0.52) (0.84) (2.25) (0.82) 0.73 0.59 0.75 DTP (0 12) (0.04) 0.73 (0.06) CCTV (0.13) 2.11 2.12 (0.39) 288.5 (4 14) Prison (0.5) 182.5 191.6 219.95 Intercept (11.52) (6.68) (5.26) 0.64 0.75 0.12 0.75 R 220 220 220 220 Heteroskedasticity-robust standard errors are given in parentheses under coefficients. Which of the following statements…arrow_forwardWhat are the Standard Errors for Fixed Effects Regression?arrow_forward
- The Conde Nast Traveler Gold List for 2012 provided rating for the top 20 small cruise ships. The data from annual Readers’ Choice Survey are the overall scores(Y) each ship received based on several criteria, including Itineraries/Schedule (X1), Shore Excursions(X2), and Food/Dinning(X3). The estimated regression equation to predict the overall scores is Y= 35.6184+0.1105 X1+0.2445 X2+0.2474 X3. Part of the regression results is shown below. Coefficients Standard Error Intercept 35.6184 13.2308 Itineraries/Schedule(X1) 0.1105 0.1297 Shore Excursions(X2) 0.2445 0.0434 Food/Dinning(X3) 0.2474 0.0621 Use the T test to determine whether or not the coefficient of X1 is significant. Use Level of significance=.05? Be sure to state null and alternative hypotheses.…arrow_forwardAcrylamide is a chemical that is sometimes found in cooked starchy foods and which is thought to increase the risk of certain kinds of cancer. The paper "A Statistical Regression Model for the Estimation of Acrylamide Concentrations in French Fries for Excess Lifetime Cancer Risk Assessment"+ describes a study to investigate the effect of frying time (in seconds) and acrylamide concentration (in micrograms per kilogram) in french fries. The data in the accompanying table are approximate values read from a graph that appeared in the paper. Frying Acrylamide Time Concentration 150 240 240 270 300 300 150 125 + 195 185 135 275 USE SALT (a) Find the equation of the least-squares line for predicting acrylamide concentration using frying time. (Round your answers to four decimal places.) ŷ = (b) Does the equation of the least-squares line support the conclusion that longer frying times tend to be paired with higher acrylamide concentrations? Explain. O No, the least squares regression line…arrow_forwardA researcher plans to study the causal effect of police on crime using data from a random sample of U.K. counties. He plans to regress the county’s crime rate on the (per capita) size of the county’s police force. Explain why this regression is likely to suffer from omitted variable bias. Which variable would you add to the regression to controlfor important omitted variable? Determine whether the regression will likely over or underestimate the effect of police on the crime rate?arrow_forward
- I recently asked this question and was wondering if you could show me how to do it, not just putting it in a caculator or excel but written out equations and seeing my information plugged in so I can understand. Thank you. Calculate the simple linear regression to determine if the amount of time spent on homework can be predicted by amount of sleep. Graph the relationship and determine, numerically, if there are any outliers. Interpret all results in a paragraph citing the appropriate statisitcs.arrow_forwardShow the best fitted line on scatter diagram and Find the predicted value for each y using the exposure time and the equation obtained in part b (b. Find the equation of regression line between radiation doses on exposure time .usingleast square method)arrow_forwardProvide an example of a regression that arguably would have a high value of R² but would produce biased and inconsistent estimators of a causal effect. Explain why the R² is likely to be high. Explain why the OLS estimators would be biased and inconsistent.arrow_forward
- A group of Maternal and Child Health public health practitioners are interested in the relationship between depression and a number of health outcomes. Suppose the research team gathers information on a group of participants, and constructs a multiple linear regression model looking at the relationship between depression and household income dichotomized as above and below the federal poverty line controlling for a number of potential confounders. The following is a computerized output displaying the results of their analysis. Parameter Estimate Standard Error t Value Pr > |t| Intercept 0.2617346843 0.09209917 2.84 0.0046 Income (1/0) -.1962038300 0.04574793 -4.29 <.0001 Race (W or AA) -.0320329506 0.03900447 -0.82 0.4118 bmicontinuous 0.0051185980 0.00216986 2.36 0.0186 Alcohol (Y/N) -.0088735044 0.03090631 -0.29 0.7741 A) What are the independent and dependent variables? B) Which potential…arrow_forwardThis is my question! All parts please.arrow_forward
arrow_back_ios
arrow_forward_ios
Recommended textbooks for you
 MATLAB: An Introduction with ApplicationsStatisticsISBN:9781119256830Author:Amos GilatPublisher:John Wiley & Sons Inc
 Probability and Statistics for Engineering and th...StatisticsISBN:9781305251809Author:Jay L. DevorePublisher:Cengage Learning
 Statistics for The Behavioral Sciences (MindTap C...StatisticsISBN:9781305504912Author:Frederick J Gravetter, Larry B. WallnauPublisher:Cengage Learning
 Elementary Statistics: Picturing the World (7th E...StatisticsISBN:9780134683416Author:Ron Larson, Betsy FarberPublisher:PEARSON
 The Basic Practice of StatisticsStatisticsISBN:9781319042578Author:David S. Moore, William I. Notz, Michael A. FlignerPublisher:W. H. Freeman
 Introduction to the Practice of StatisticsStatisticsISBN:9781319013387Author:David S. Moore, George P. McCabe, Bruce A. CraigPublisher:W. H. Freeman

MATLAB: An Introduction with Applications
Statistics
ISBN:9781119256830
Author:Amos Gilat
Publisher:John Wiley & Sons Inc

Probability and Statistics for Engineering and th...
Statistics
ISBN:9781305251809
Author:Jay L. Devore
Publisher:Cengage Learning

Statistics for The Behavioral Sciences (MindTap C...
Statistics
ISBN:9781305504912
Author:Frederick J Gravetter, Larry B. Wallnau
Publisher:Cengage Learning

Elementary Statistics: Picturing the World (7th E...
Statistics
ISBN:9780134683416
Author:Ron Larson, Betsy Farber
Publisher:PEARSON

The Basic Practice of Statistics
Statistics
ISBN:9781319042578
Author:David S. Moore, William I. Notz, Michael A. Fligner
Publisher:W. H. Freeman

Introduction to the Practice of Statistics
Statistics
ISBN:9781319013387
Author:David S. Moore, George P. McCabe, Bruce A. Craig
Publisher:W. H. Freeman