
Introduction To Statistics And Data Analysis
6th Edition
ISBN: 9781337793612
Author: PECK, Roxy.
Publisher: Cengage Learning,
expand_more
expand_more
format_list_bulleted
Concept explainers
Videos
Textbook Question
Chapter 14.2, Problem 34E
This exercise requires the use of a statistical software package. The accompanying data resulted from a study of the relationship between y = Brightness of finished paper and the independent variables x1 = Hydrogen peroxide (% by weight), x2 = Sodium hydroxide (% by weight), x3 = Silicate (% by weight), and x4 = Process temperature (“Advantages of CE-HDP Bleaching for High Brightness Kraft Pulp Production,” TAPPI [1964]: 107A-173A).
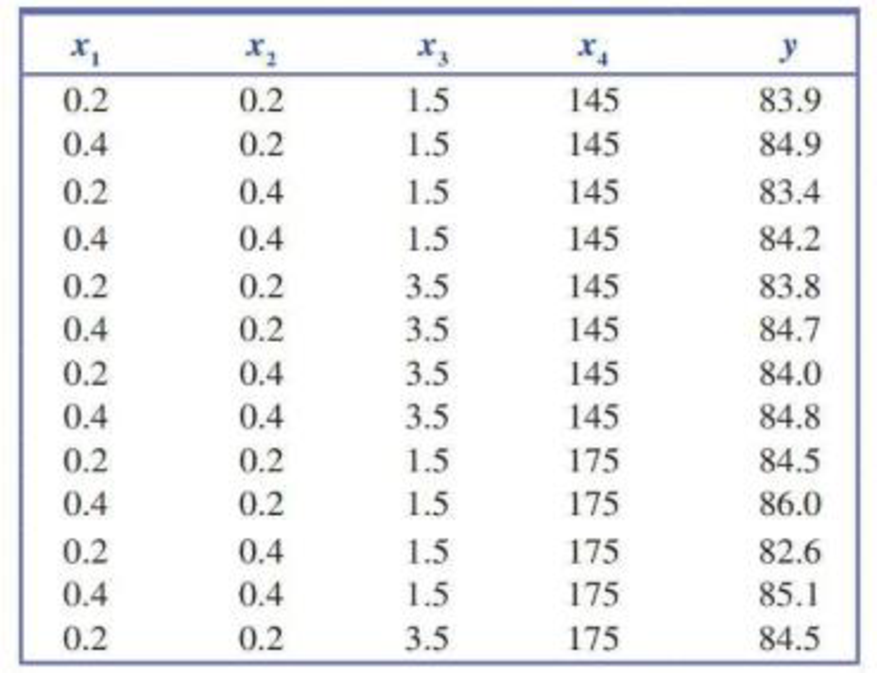
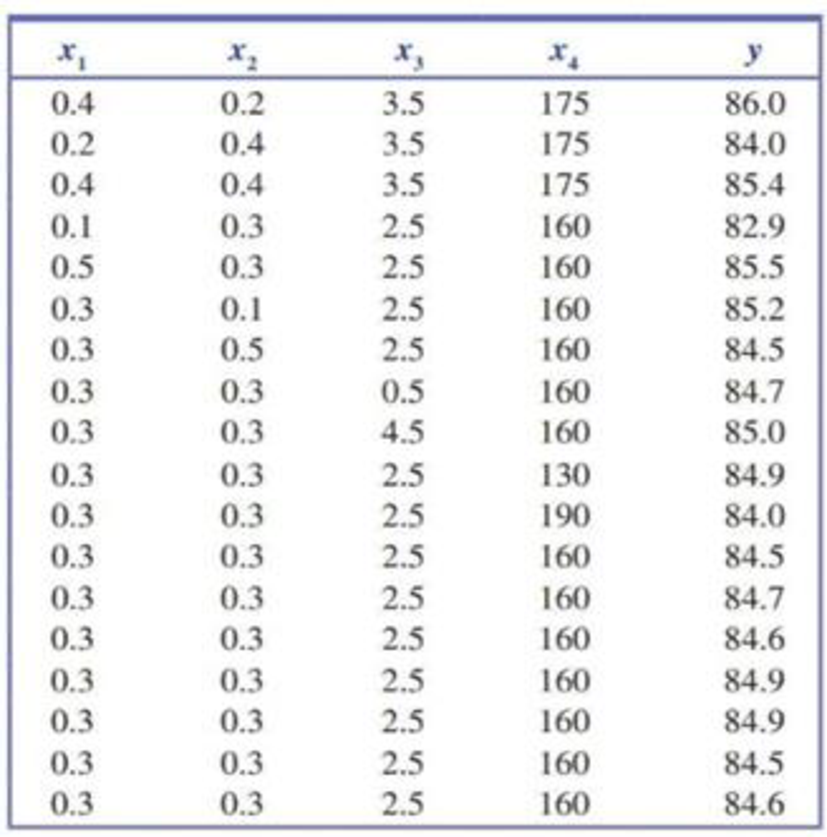
- a. Find the estimated regression equation for the model that includes all independent variables, all quadratic terms, and all interaction terms.
- b. Using a 0.05 significance level, carry out the model utility test.
- c. Interpret the values of the following quantities: SSResid, R2, and se.
Expert Solution & Answer
Want to see the full answer?
Check out a sample textbook solution
Students have asked these similar questions
Foot ulcers are a common problem for people with diabetes. Higher skin temperatures on
the foot indicate an increased risk of ulcers. The article "An Intelligent Insole for Diabetic
Patients with the Loss of Protective Sensation" (Kimberly Anderson, M.S. Thesis, Colorado
School of Mines), reports measurements of temperatures, in °F, of both feet for 181
diabetic patients. The results are presented in the following table.
Left Foot
Right Foot
80
80
85
85
75
80
88
86
89
87
87
82
78
78
88
89
89
90
76
81
89
86
87
82
78
78
80
81
87
82
86
85
76
80
88
89
Construct a scatterplot of the right foot temperature (y) versus the left foot temperature
(x). Verify that a linear model is appropriate.
b.
Compute the least-squares line for predicting the right foot temperature from the left
foot temperature.
If the left foot temperatures of two patients differ by 2 degrees, by how much would
you predict their right foot temperatures to differ?
Predict the right foot temperature for a patient whose left…
In the early stages of design, it is believed that the cost of aMartian rover spacecraft is related to its weight. Cost and weight data for six spacecraft have been collected and normalized and are shown in the next table. A plot of the data suggests a linear relationship. Use a spreadsheet model to determine the values of the coefficients for the CER. Determine the SE and the correlation coefficient for the CER developed above.
NutritionResearchers compared protein intake among threegroups of postmenopausal women: (1) women eating astandard American diet (STD), (2) women eating a lactoovo-vegetarian diet (LAC), and (3) women eating a strictvegetarian diet (VEG). The mean ± 1 sd for protein intake(mg) is presented in Table 12.29.
12.5 Using the data in Table 12.29, perform a multiplecomparisons procedure to identify which specific underlyingmeans are different.
Chapter 14 Solutions
Introduction To Statistics And Data Analysis
Ch. 14.1 - Prob. 1ECh. 14.1 - The authors of the paper Weight-Bearing Activity...Ch. 14.1 - Prob. 3ECh. 14.1 - Prob. 4ECh. 14.1 - Prob. 5ECh. 14.1 - Prob. 6ECh. 14.1 - Prob. 7ECh. 14.1 - Prob. 8ECh. 14.1 - Prob. 9ECh. 14.1 - The relationship between yield of maize (a type of...
Ch. 14.1 - Prob. 11ECh. 14.1 - A manufacturer of wood stoves collected data on y...Ch. 14.1 - Prob. 13ECh. 14.1 - Prob. 14ECh. 14.1 - Prob. 15ECh. 14.2 - Prob. 16ECh. 14.2 - State as much information as you can about the...Ch. 14.2 - Prob. 18ECh. 14.2 - Prob. 19ECh. 14.2 - Prob. 20ECh. 14.2 - The ability of ecologists to identify regions of...Ch. 14.2 - Prob. 22ECh. 14.2 - Prob. 23ECh. 14.2 - Prob. 24ECh. 14.2 - Prob. 25ECh. 14.2 - Prob. 26ECh. 14.2 - This exercise requires the use of a statistical...Ch. 14.2 - Prob. 28ECh. 14.2 - The article The Undrained Strength of Some Thawed...Ch. 14.2 - Prob. 30ECh. 14.2 - Prob. 31ECh. 14.2 - Prob. 32ECh. 14.2 - Prob. 33ECh. 14.2 - This exercise requires the use of a statistical...Ch. 14.2 - This exercise requires the use of a statistical...Ch. 14.3 - Prob. 36ECh. 14.3 - Prob. 37ECh. 14.3 - When Coastal power stations take in large amounts...Ch. 14.3 - Prob. 39ECh. 14.3 - The article first introduced in Exercise 14.28 of...Ch. 14.3 - Data from a random sample of 107 students taking a...Ch. 14.3 - Benevolence payments are monies collected by a...Ch. 14.3 - Prob. 43ECh. 14.3 - Prob. 44ECh. 14.3 - Prob. 45ECh. 14.3 - Prob. 46ECh. 14.3 - Exercise 14.26 gave data on fish weight, length,...Ch. 14.3 - Prob. 48ECh. 14.3 - Prob. 49ECh. 14.3 - Prob. 50ECh. 14.4 - Prob. 51ECh. 14.4 - Prob. 52ECh. 14.4 - The article The Analysis and Selection of...Ch. 14.4 - Prob. 54ECh. 14.4 - Prob. 55ECh. 14.4 - Prob. 57ECh. 14.4 - Prob. 58ECh. 14.4 - Prob. 59ECh. 14.4 - Prob. 60ECh. 14.4 - This exercise requires use of a statistical...Ch. 14.4 - Prob. 62ECh. 14 - Prob. 63CRCh. 14 - Prob. 64CRCh. 14 - The accompanying data on y = Glucose concentration...Ch. 14 - Much interest in management circles has focused on...Ch. 14 - Prob. 67CRCh. 14 - Prob. 68CRCh. 14 - Prob. 69CRCh. 14 - A study of pregnant grey seals resulted in n = 25...Ch. 14 - Prob. 71CRCh. 14 - Prob. 72CRCh. 14 - This exercise requires the use of a statistical...
Knowledge Booster


Learn more about
Need a deep-dive on the concept behind this application? Look no further. Learn more about this topic, statistics and related others by exploring similar questions and additional content below.Similar questions
- A recent experiment included measuring the weight of a package of raw almonds. This type of data would be considered a: Discrete variable or Continuous variable?arrow_forwardResearchers compared protein intake among threegroups of postmenopausal women: (1) women eating astandard American diet (STD), (2) women eating a lactoovo-vegetarian diet (LAC), and (3) women eating a strictvegetarian diet (VEG). The mean ± 1 sd for protein intake(mg) is presented in Table 12.29.arrow_forwardThe authors of the paper "Statistical Methods for Assessing Agreement Between Two Methods of Clinical Measurement" compared two different instruments for measuring a subject's ability to breathe out air.+ (This measurement is helpful in diagnosing various lung disorders.) The two instruments considered were a Wright peak flow meter and a mini-Wright peak flow meter. Seventeen subjects participated in the study, and for each subject air flow was measured once using the Wright meter and once using the mini-Wright meter. Mini- Subject Wright Meter 1 2 3 4 5 6 7 8 9 512 430 520 428 500 600 364 380 658 Wright Meter 494 395 516 434 476 557 413 442 650 Subject 10 11 12 13 14 15 16 17 Mini- Wright Meter 445 432 626 260 477 259 350 451 Wright Meter 433 417 656 267 478 178 423 427 (a) Suppose that the Wright meter is considered to provide a better measure of air flow, but the mini-Wright meter is easier to transport and to use. If the two types of meters produce different readings but there is a…arrow_forward
- During the graphical analysis of the data below, two different curves were fitted to the data using the least squares method. The curves are as follows. Decide which curve is more suitable by calculating the correlation coefficients.arrow_forwardUnfortunately, arsenic occurs naturally in some ground water. A mean arsenic level of μ=8 parts per billion (ppb) is considered safe for agricultural use. A well in Los Banos is used to water cotton crops. This well is tested on a regular basis for arsenic. A random sample of 37 tests gave a sample mean of x=7.3 ppb arsenic. It is known that σ=1.9 ppb for this type of data. Does this information indicate that the mean level of arsenic in this well is less than 8 ppb? Use the classical approach. Use α=0.01 What is the hypotheses for this problem? A: Ho μ =7.3ppb vs HA μ < 7.3ppb B: Ho μ <7.3ppb vs HA μ ≥ 7.3ppb C: Ho μ =8.0ppb vs HA μ < 8.0ppb D: Ho μ <8.0ppb vs HA μ ≥ 8.0ppbarrow_forwardA statistical program is recommended. The accompanying data resulted from a study of the relationship between y = brightness of finished paper and the independent variables x₁ = hydrogen peroxide (% by weight), x₂ = sodium hydroxide (% by weight), x3 =silicate (% by weight), and x = process temperature.+ 4 X₂ X3 X4 y 0.2 0.2 1.5 145 83.9 84.9 0.4 0.2 1.5 145 0.2 0.4 1.5 145 83.4 0.4 0.4 1.5 145 84.2 0.2 0.2 3.5 145 83.8 0.4 0.2 3.5 145 84.7 0.2 0.4 3.5 145 84.0 0.4 0.4 3.5 145 84.8 0.2 0.2 1.5 175 84.5 0.4 0.2 1.5 175 86.0 82.6 0.4 0.4 1.5 175 85.1 0.2 0.4 1.5 175 0.2 0.2 3.5 175 84.5 0.4 0.2 3.5 175 86.0 0.2 0.4 3.5 175 84.0 0.4 0.4 3.5 175 85.4 Hg: P₁ P₂P₁40 = OH: at least one of P₁ P₂ or ₁4 is not 0. 1' 14 (a) Find the estimated regression equation for the model that includes all independent variables, all quadratic terms, and all interaction terms. (Round your numerical values to five decimal places.) ŷ = Hg: P₁ P₂P₁40 = = x1 X₁ X₂ 0.1 0.3 2.5 160 82.9 (b) Using a 0.05 significance…arrow_forward
- The road octane numbers of two different formulations of gasoline are being studied. A random sample of size n, = 15 is taken for formulation 1; while, for formulation 2, the random sample size is na = 20. The variance of the octane number for formulation 1 is a, 2 =1 5, and for formulation 2, it is a,2 =1 2. The mean octane numbers observed are x, = 89.6 and x, = 92.5. Assume normality. What is the upper limit of a 95% two- sided confidence interval on the difference in mean octane number (u, - H)?arrow_forwardIn comparing the hexokinase method with the glucose oxidase method for measuring glucose it was found that the mean and standard deviation for the hexokinase method was 120 mg/dl and 4.8 mg/dl respectively. The mean and standard deviation for the glucose oxidase method were 100 mg/dl and 4.0 mg/dl. Graphical analysis, however, seemed to indicate that there was not more variation present in the hexokinase method. Which evaluation method really exhibited the greatest variability? (A) Hexokinase method (C) Neither (B) Glucose oxidase method (D) Cannot be determinedarrow_forwardFind the correlation coefficient between the “modules studied in the last semester and number of hours spend on reading the books” from your collected data.arrow_forward
- You were given a dataset that includes 100 datapoints for expenses in Canadian dollars and waste in kilo grams. Based on the data you were able to calculate the following: The variance of the expenses = 78515151.52 The variance of the waste amount 14602.38, The R squared = 0.372460641, Intercept = cS 34046.3765, Total waste amount = 54420 kg ion Then the slope of the regression line is (approximately) O a 44,75124 O b. 54.420 Oc 5840 Od. 34.04637arrow_forwardAn experiment was designed to study oil additives that could reduce polluting the air. Two additives were considered in the study. The two additives X1 and X2 were controlled and the level of the pollution Y is observed. The data were as follows: Y X1 X2 3.9 1.5 2.2 7.5 1.5 4.5 4.4 1.7 2.2 8.7 1.8 4.4 9.6 5.5 4.3 8.5 5.5 4.5 What are the assumptions for the regression model? How is the fit of the model?arrow_forwardAn experiment was designed to study oil additives that could reduce polluting the air. Two additives were considered in the study. The two additives X1 and X2 were controlled and the level of the pollution Y is observed. The data were as follows: Y X1 X2 3.9 1.5 2.2 7.5 1.5 4.5 4.4 1.7 2.2 8.7 1.8 4.4 9.6 5.5 4.3 8.5 5.5 4.5 Find the regression equation Is the model valid? Which independent variable is linearly related to Y?arrow_forward
arrow_back_ios
SEE MORE QUESTIONS
arrow_forward_ios
Recommended textbooks for you
 MATLAB: An Introduction with ApplicationsStatisticsISBN:9781119256830Author:Amos GilatPublisher:John Wiley & Sons Inc
 Probability and Statistics for Engineering and th...StatisticsISBN:9781305251809Author:Jay L. DevorePublisher:Cengage Learning
 Statistics for The Behavioral Sciences (MindTap C...StatisticsISBN:9781305504912Author:Frederick J Gravetter, Larry B. WallnauPublisher:Cengage Learning
 Elementary Statistics: Picturing the World (7th E...StatisticsISBN:9780134683416Author:Ron Larson, Betsy FarberPublisher:PEARSON
 The Basic Practice of StatisticsStatisticsISBN:9781319042578Author:David S. Moore, William I. Notz, Michael A. FlignerPublisher:W. H. Freeman
 Introduction to the Practice of StatisticsStatisticsISBN:9781319013387Author:David S. Moore, George P. McCabe, Bruce A. CraigPublisher:W. H. Freeman
MATLAB: An Introduction with Applications
Statistics
ISBN:9781119256830
Author:Amos Gilat
Publisher:John Wiley & Sons Inc
Probability and Statistics for Engineering and th...
Statistics
ISBN:9781305251809
Author:Jay L. Devore
Publisher:Cengage Learning
Statistics for The Behavioral Sciences (MindTap C...
Statistics
ISBN:9781305504912
Author:Frederick J Gravetter, Larry B. Wallnau
Publisher:Cengage Learning
Elementary Statistics: Picturing the World (7th E...
Statistics
ISBN:9780134683416
Author:Ron Larson, Betsy Farber
Publisher:PEARSON
The Basic Practice of Statistics
Statistics
ISBN:9781319042578
Author:David S. Moore, William I. Notz, Michael A. Fligner
Publisher:W. H. Freeman
Introduction to the Practice of Statistics
Statistics
ISBN:9781319013387
Author:David S. Moore, George P. McCabe, Bruce A. Craig
Publisher:W. H. Freeman
Correlation Vs Regression: Difference Between them with definition & Comparison Chart; Author: Key Differences;https://www.youtube.com/watch?v=Ou2QGSJVd0U;License: Standard YouTube License, CC-BY
Correlation and Regression: Concepts with Illustrative examples; Author: LEARN & APPLY : Lean and Six Sigma;https://www.youtube.com/watch?v=xTpHD5WLuoA;License: Standard YouTube License, CC-BY