
Concept explainers
Videos
When Coastal power stations take in large amounts of cooling water, it is inevitable that a number of fish are drawn in with the water. Twenty-six observations from the article “Multiple
The regression equation is Y = 92.0 − 2.18X1 − 19.2X2 − 9.38X3 + 2.32X4
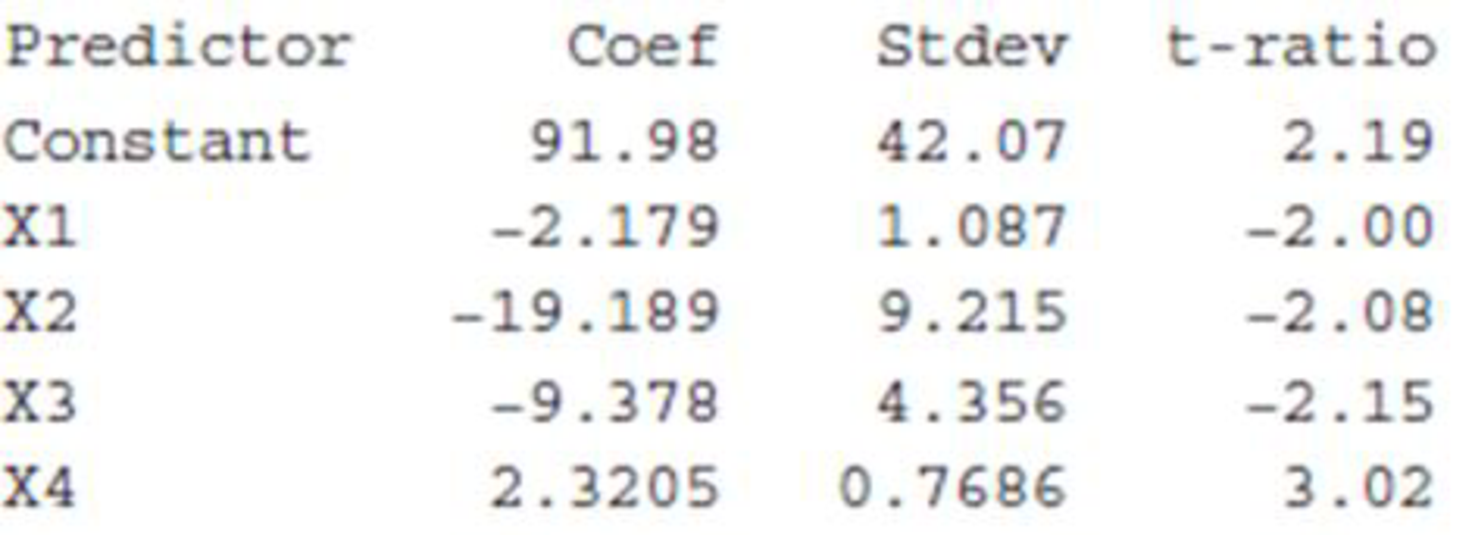
s = 10.53 R–sq = 39.0% R–sq(adj) = 27.3%
- a. Construct a 95% confidence interval for β3, the coefficient of x3 = sea State. Interpret the resulting interval.
- b. Construct a 90%’ confidence interval for the mean change in y associated with a 1° increase in temperature when number of pumps, sea State, and speed remain fixed.

Trending nowThis is a popular solution!

Chapter 14 Solutions
Introduction To Statistics And Data Analysis


- Find the equation of the regression line for the following data set. x 1 2 3 y 0 3 4arrow_forwardIf your graphing calculator is capable of computing a least-squares sinusoidal regression model, use it to find a second model for the data. Graph this new equation along with your first model. How do they compare?arrow_forwardIdentify two graphs used in a residual analysis to check the Assumptions 1–3 for regression inferences, and explain the reasoning behind their use.arrow_forward
- Suppose a study wants to predict the market price of a certain species of turtle (Y) based on the following independent variables indicated in the table. Based from the table, what is the equation of the multiple linear regression? (Round off up to two decimal places. Market Price = 0.07 - 0.40*weight + 1.51*length + 1.41*width + 0.80*age Market Price = - 0.40*weight + 1.51*length + 1.41*width + 0.80*age Market Price = 0.07 + 0.40*weight + 1.51*length + 1.41*width + 0.80*age Market Price = 0.07 - 0.40 + weight + 1.51 + length + 1.41 + width + 0.80 + agearrow_forwardThe quality of the orange juice produced by a certain manufacturer is constantly monitored. Data collected on the sweetness index of an orange juice sample and amount of water-soluble pectin for 24 production runs at a juice manufacturing plant are shown in the accompanying table. Suppose a manufacturer wants to use simple linear regression to predict the sweetness (y) from the amount of pectin (x). Find and interpret the coefficient of determination, r2, and the coefficient of correlation, r. Find and interpret the coefficient of determination, r2. Select the correct choice below and fill in the answer box within your choice. (Round to three decimal places as needed.) A. The coefficient of determination, r2, is enter your response here. Sample variations in the amount of water-soluble pectin explain 100r2% of the sample variation in the sweetness index using the least squares line. B. The coefficient of determination, r2, is enter your…arrow_forwardThe weight (in pounds) and height (in inches) for a child were measured every few months over a two-year period. The results are displayed in the scatterplot. The equation ŷ = 17.4 + 0.5x is called the least-squares regression line because it is least able to make accurate predictions for the data. makes the strongest association between weight and height. minimizes the sum of the squared distances from the actual y-value to the predicted y-value. maximizes the sum of the squared distances from the actual y-value to the predicted y-value.arrow_forward
- A local University conducted a survey of over 2,000 MBA alumni to explore the issue of work-life balance. Each participant received a score ranging from 0 to 100, with lower scores indicating a higher imbalance between work and life. A sample of the data is available below. Let x=average number of hours worked per week and y= work-life balance scale score for each MBA alumnus. Investigate the link between these two variables by conducting a complete simple linear regression analysis of the data. Summarize your findings. Hours WLB Score 50 74.09 45 72.45 50 52.93 55 44.33 50 69.15 60 54.79 55 56.26 60 20.44 55 6-.64 50 69.15 70 29.16 45 72.45 40 33.25 40 32.18 45 45.76 a. What is the test statistic for the hypotheses? t=______ b. What is the p-value for the test statistic? p-value=________ c. What is the value for the coeffiecent of determination r^2? r^2=________arrow_forwardA local University conducted a survey of over 2,000 MBA alumni to explore the issue of work-life balance. Each participant received a score ranging from 0 to 100, with lower scores indicating a higher imbalance between work and life. A sample of the data is available below. Let x=average number of hours worked per week and y=work-life balance scale score for each MBA alumnus. Investigate the link between these two variables by conducting a complete simple linear regression analysis of the data. Summarize your findings. Hours WLB Score 50 73.22 45 70.79 50 48.78 55 44.15 55 69.89 60 53.15 50 56.04 60 22.53 50 60.73 55 69.89 70 29.17 45 70.79 40 33.38 40 32.13 45 46.17 Check the usefulness of the hypothesized model. What are the hypotheses to test?…arrow_forwardA local University conducted a survey of over 2,000 MBA alumni to explore the issue of work-life balance. Each participant received a score ranging from 0 to 100, with lower scores indicating a higher imbalance between work and life. A sample of the data is available below. Let x=average number of hours worked per week and y=work-life balance scale score for each MBA alumnus. Investigate the link between these two variables by conducting a complete simple linear regression analysis of the data. Summarize your findings. Hours WLB Score 50 73.22 45 70.79 50 48.78 55 44.15 55 69.89 60 53.15 50 56.04 60 22.53 50 60.73 55 69.89 70 29.17 45 70.79 40 33.38 40 32.13 45 46.17 The least squares regression equation is y=enter your response here+enter your…arrow_forward
- A local University conducted a survey of over 2,000 MBA alumni to explore the issue of work-life balance. Each participant received a score ranging from 0 to 100, with lower scores indicating a higher imbalance between work and life. A sample of the data is available below. Let x= average number of hours worked per week and y = work-life balance scale score for each MBA alumnus. Investigate the link between these two variables by conducting a complete simple linear regression analysis of the data. Summarize your findings. E Click the icon to view the data. The least squares regression equation is y =+ (Ox X. (Round to two decimal places as needed.) Revenue and message rate for recekt movies Check the usefulness of the hypothesized model. What are the hypotheses to test? O A. Ho: Po * 0 against H: Po = 0 O B. Ho: B, #0 against H: B, = 0 Hours WLB Score 50 45 77.01 OC. Ho: Po = 0 against H: Po #0 72.02 49.07 50 O D. Ho: B, = 0 against H: B, #0 60 50 44.14 69.95 Determine the estimate of…arrow_forwardA local University conducted a survey of over 2,000 MBA alumni to explore the issue of work-life balance. Each participant received a score ranging from 0 to 100, with lower scores indicating a higher imbalance between work and life. A sample of the data is available below. Let x = average number of hours worked per week and y=work-life balance scale score for each MBA alumnus. Investigate the link between these two variables by conducting a complete simple linear regression analysis of the data. Summarize your findings. E Click the icon to view the data. The least squares regression equation is y =+ (Ox. (Round to two decimal places as needed.) Revenue and Message Rate for Recent Movies Check the usefulness of the hypothesized model. What are the hypotheses to test? O A. H Bo =0 against H: Bo #0 Hours WLB Score 50 75.22 B. H: B, #0 against H: B, =0 45 78.45 OC. H B, = 0 against H B, 0 50 49.68 55 40.11 OD. H Bo#0 against H: Bo =0 50 70.41 60 55.91 Determine the estimate of the…arrow_forwardAssume we have data demonstrating a strong linear link between the amount of fertilizer applied to certain plants and their yield. Which is the independent variable in this research question?arrow_forward
 Calculus For The Life SciencesCalculusISBN:9780321964038Author:GREENWELL, Raymond N., RITCHEY, Nathan P., Lial, Margaret L.Publisher:Pearson Addison Wesley,
 Trigonometry (MindTap Course List)TrigonometryISBN:9781305652224Author:Charles P. McKeague, Mark D. TurnerPublisher:Cengage Learning
 Functions and Change: A Modeling Approach to Coll...AlgebraISBN:9781337111348Author:Bruce Crauder, Benny Evans, Alan NoellPublisher:Cengage Learning