Biochemistry: Concepts and Connections (2nd Edition)
2nd Edition
ISBN: 9780134641621
Author: Dean R. Appling, Spencer J. Anthony-Cahill, Christopher K. Mathews
Publisher: PEARSON
expand_more
expand_more
format_list_bulleted
Concept explainers
Videos
Textbook Question
Chapter 8, Problem 7P
The initial rate for an enzyme-catalyzed reaction has been determined at a number of substrate concentrations. Data are as follows:
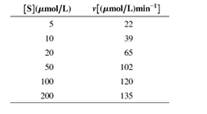
- Estimate Vmax and KM from a direct graph v versus [S]. Do you find difficulties in getting clear answers?
- Now use a Lineweaver-Burk plot to analyze the same data. Does this work better?
Expert Solution & Answer
Want to see the full answer?
Check out a sample textbook solution
Students have asked these similar questions
The Lineweaver-Burk plot, which illustrates the reciprocal of the reaction rate (1/v) versus the reciprocal of the substrate concentration (1/[S]), is a graphical
representation of enzyme kinetics. This plot is typically used to determine the maximum rate, Vmax, and the Michaelis constant, Km, which can be gleaned from
the intercepts and slope. Identify each intercept and the slope in terms of the constants Vmax and Km. What term is represented by C?
Linewegver-Burk Pt
1/Vmax
O A.
В.
-1/Km
Km/Vmax
C.
The Michaelis-Menten equation is often used to describe the kinetic characteristics of an enzyme-catalyzed reaction.
Vmax [S]
Km + [S]
where v is the velocity, or rate, Vmax is the maximum velocity. K is the Michaelis-Menten constant, and [S] is the
substrate concentration.
A graph of the Michaelis-Menten equation is a plot of a reaction's initial velocity (ro) at different substrate concentrations
([S]).
First, move the line labeled Vmax to a position that represents
the maximum velocity of the enzyme.
Next, move the line labeled 1/2 Vmax to its correct position.
Then, move the line labeled Km to its correct position.
Estimate the values for Vmax and Km-
Vmax=
µM/min
v (µM/min)
300
275
250
225
200
175
150
125
100
75
50
Km =
25
K
0 10
20
30
V
max
40 50
[S] (M)
1/2 V
max
Michaelis-Menten curve
60 70 80
90 100
HM
A researcher has measured the initial rate of an enzyme-catalyzed reaction as a function of substrate concentration in the presence and absence of 0.001μM inhibitor. She obtains the following data.
What is the Vmax and Km for the "no inhibitor" and "+ inhibitor" experiments. Ans, What would be value of V0 for the "+inhibitor" at [S] = 0.4μM and the inhibitor is most likely a competitive, uncompetitive or mixed inhibitor.
Chapter 8 Solutions
Biochemistry: Concepts and Connections (2nd Edition)
Ch. 8 - Prob. 1PCh. 8 - The enzyme urease catalyzes the hydrolysis of urea...Ch. 8 - An enzyme contains an active site aspartic acid...Ch. 8 - The folding and unfolding rate constants for a...Ch. 8 - In some reactions, in which a protein molecule is...Ch. 8 - Would you expect an “enzyme” designed to bind to...Ch. 8 - The initial rate for an enzyme-catalyzed reaction...Ch. 8 - a. If the total enzyme concentration in Problem 7...Ch. 8 - Prob. 9PCh. 8 - Prob. 10P
Ch. 8 - The following data describe the catalysis of...Ch. 8 - At 37 oC, the serine protease subtilisin has kcat...Ch. 8 - The accompanying figure shows three...Ch. 8 - The steady-state kinetics of an enzyme are studied...Ch. 8 - The same enzyme as in Problem 14 is studied in the...Ch. 8 - Enalapril is an anti-hypertension “pro-drug"...Ch. 8 - Initial rate data for an enzyme that obeys...Ch. 8 - Prob. 18PCh. 8 - Suggest the effects of each of the following...Ch. 8 - The inhibitory effect of an uncompetitive...Ch. 8 - Prob. 21PCh. 8 - Prob. 22PCh. 8 - Prob. 23PCh. 8 - In kinetics experiments, the hydrolysis of the...
Knowledge Booster


Learn more about
Need a deep-dive on the concept behind this application? Look no further. Learn more about this topic, biochemistry and related others by exploring similar questions and additional content below.Similar questions
- The initial velocities of two different enzyme-catalyzed reactions were measured over a series of substrate concentrations. The following results were obtained: Enyme A: KM = 1.5 mM, Vmax = 10 μM s-1 Enyme B: KM = 5.0 mM, Vmax = 85 µM s-1 (a) Which enzyme binds to its substrate more tightly (assume k.1 >> k₂ in the Michaelis-Menten model)? (b) Calculate the initial velocities of each reaction when the substrate concentration is 2.5 mM. (c) Calculate the Kcat of each enzyme if the total enzyme concentration is 100 nM. (d) Which enzyme is the more efficient catalyst? Explain your answer. The enzyme carbonic anhydrase is strongly inhibited by the drug acetazolamide. A plot of the initial reaction velocity (as a percentage of Vmax) in the absence and presence of the inhibitor is shown below. What type of inhibition is taking place? Explain your reasoning. V (% of Vmax) 100 50 0.2 0.4 No inhibitor Acetazolamide [S] (MM) 0.6 0.8 1arrow_forwardYou have obtained experimental kinetic data for two versions of the same enzyme, a wild‑type and a mutant differing from the wild‑type at a single amino acid. The data are given in the table. Compare the kinetic parameters of the two versions using the data in the table. Assuming a two-step reaction scheme in which ?−1 is much larger than ?2, which of the following statements are correct? The mutant version has a higher affinity for the substrate. The wild‑type version requires a greater concentration of substrate to achieve ?maxVmax. The wild‑type version has a higher affinity for the substrate. The mutant version requires a greater concentration of substrate to achieve ?maxVmax. Calculate the initial velocity of the reaction catalyzed by the wild‑type enzyme when the substrate concentration is 10 mM. The reaction equilibrium is reached once there is no net change in the concentration of the substrate or the product. Based on the data table and your initial…arrow_forwardThe process of protein decomposition by pepsin enzymes in stomach is assumed and modeled as a batch reactor. If the protein concentration over time is measured as follows: Write the relationship between time (t), protein concentration (CA). Assuming that the enzyme reaction follows Michaelis-Menten kinetics, write the required constant (Vmax, Km), and the initial concentration of the protein is CA0.arrow_forward
- By using Excel or GoogleSheets, graph the Lineweaver-Burk plots for the behavior of an enzyme for which the following experimental data are available. What are the Km and V values for the inhibited and uninhibited reactions? Is the inhibitor competitive or max noncompetitive? [S] (mM) V, No Inhibitor (mmol min-') V, Inhibitor Present (mmol min-') 1× 10⁻⁴ 5 × 10⁻⁴ 1.5 × 10⁻³ 2.5 × 10⁻³ 5 × 10⁻³ 0.026 0.092 0.136 0.150 0.010 0.040 0.086 0.120 0.165 0.142 Activatearrow_forwardAn experiment on enzyme-catalyzed reaction was conducted in the laboratory by a student. Results obtained are summarized in the table below. In all the experiments, the concentration of the enzyme is the same. Substrate Concentration Velocity (pmol) (pmol/min) 1.5 0.21 0.28 4 0.32 6 0.36 0.4 15 0.45 18 0.47 1. Plot or graph these results using the Lineweaver-Burk method. 2. Determine the Km and Vmax values. Show all equations and calculations.arrow_forwardFrom a series of flasks with a constant concentration of enzyme the following initial velocities weretaken, they were obtained as a function of the concentration of the substrate.a) Calculate the KM and Vmax kinetic parameters of the three forms (Lineweaver-Burk, Eadie-Hofstee, Dixon).b) Analyze which are the atypical data that cause a low correlation, which can be eliminated and explain youranswer.arrow_forward
- The change in the amount of product B in a reaction which is catalyzed by Enzyme A is given in the table below. Determine the Vmax and Km of the enzyme in the absence and presence of C. Is C an inhibitor or an activator of enzyme A? Determine the type of inhibition or activation. Rate of formation of Product B in the presence of 25 mg/mL C (mM/min) Substrate Rate of formation of (mM) Product B (mM/min) 0.5 21.5 14.1 1 30.2 22.2 1.5 34.9 27.0 2.5 39.8 33.1 3.5 42.0 36.3arrow_forwardAlthough graphical methods are available for accurate determination of the Vmax and Km of an enzyme-catalyzed reaction, sometimes these quantities can be quickly estimated by inspecting values of V0 at increasing [S]. Estimate the Vmax and Km of the enzyme-catalyzed reaction for which the following data were obtained:arrow_forwardAn experiment on enzyme-catalyzed reaction was conducted in the laboratory by a student. Results obtained are summarized in the table below. In all the experiments, the concentration of the enzyme is the same. Substrate Concentration Velocity (pmol/min) (pmol) 1.5 0.21 3 0.28 4 0.32 0.36 8 0.4 15 0.45 18 0.47 1. Plot or graph these results using the Lineweaver-Burk method. 2. Determine the KM and Vmax values. Show all equations and calculations.arrow_forward
- Given the following data in enzyme-catalyzed reaction, what are the Vm, Km of with DEDS (presence of inhibitor) and without DEDS ( absence of inhibitor) and its type of inhibition.arrow_forwardBelow is kinetic data obtained for an enzyme-catalyzed reaction. The enzyme concentration is fixed at 100 nM. Using a Lineweaver-Burke plot, calculate the kcat value for this reaction. Report your answer to three significant figures in units of 1/sec.arrow_forwardHow is the Michaelis constant defined, and what does a low or high value for Km tell you? What is the difference between the velocity and initial velocity of an enzyme reaction? What determines the efficiency of an enzyme reaction, and what terms are used to describe it?arrow_forward
arrow_back_ios
SEE MORE QUESTIONS
arrow_forward_ios
Recommended textbooks for you
 BiochemistryBiochemistryISBN:9781319114671Author:Lubert Stryer, Jeremy M. Berg, John L. Tymoczko, Gregory J. Gatto Jr.Publisher:W. H. Freeman
 Lehninger Principles of BiochemistryBiochemistryISBN:9781464126116Author:David L. Nelson, Michael M. CoxPublisher:W. H. Freeman
 Fundamentals of Biochemistry: Life at the Molecul...BiochemistryISBN:9781118918401Author:Donald Voet, Judith G. Voet, Charlotte W. PrattPublisher:WILEY
 BiochemistryBiochemistryISBN:9781305961135Author:Mary K. Campbell, Shawn O. Farrell, Owen M. McDougalPublisher:Cengage Learning
 BiochemistryBiochemistryISBN:9781305577206Author:Reginald H. Garrett, Charles M. GrishamPublisher:Cengage Learning
 Fundamentals of General, Organic, and Biological ...BiochemistryISBN:9780134015187Author:John E. McMurry, David S. Ballantine, Carl A. Hoeger, Virginia E. PetersonPublisher:PEARSON
Biochemistry
Biochemistry
ISBN:9781319114671
Author:Lubert Stryer, Jeremy M. Berg, John L. Tymoczko, Gregory J. Gatto Jr.
Publisher:W. H. Freeman
Lehninger Principles of Biochemistry
Biochemistry
ISBN:9781464126116
Author:David L. Nelson, Michael M. Cox
Publisher:W. H. Freeman
Fundamentals of Biochemistry: Life at the Molecul...
Biochemistry
ISBN:9781118918401
Author:Donald Voet, Judith G. Voet, Charlotte W. Pratt
Publisher:WILEY
Biochemistry
Biochemistry
ISBN:9781305961135
Author:Mary K. Campbell, Shawn O. Farrell, Owen M. McDougal
Publisher:Cengage Learning
Biochemistry
Biochemistry
ISBN:9781305577206
Author:Reginald H. Garrett, Charles M. Grisham
Publisher:Cengage Learning
Fundamentals of General, Organic, and Biological ...
Biochemistry
ISBN:9780134015187
Author:John E. McMurry, David S. Ballantine, Carl A. Hoeger, Virginia E. Peterson
Publisher:PEARSON
Anaerobic Respiration; Author: Bozeman Science;https://www.youtube.com/watch?v=cDC29iBxb3w;License: Standard YouTube License, CC-BY