
Concept explainers
Videos
A study was conducted of genetic and environmental influences on cholesterol levels. The data set used for the study were obtained from a twin registry in Sweden [10]. Specifically, four populations of adult twins were studied: (1) monozygotic (MZ) twins reared apart, (2) MZ twins reared together, (3) dizygotic (DZ) twins reared apart, and (4) DZ twins reared together. One issue is whether it is necessary to correct for gender before performing more complex genetic analyses. The data in Table 8.17 were presented for total cholesterol levels for MZ twins reared apart, by gender.
Table 8.17 Comparison of mean total cholesterol for MZ twins reared apart, by gender
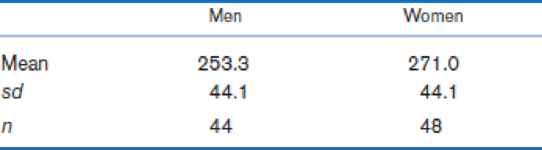
Note: n = number of people (e.g., for males, 22 pairs of twins = 44 people) the cholesterol levels within each sample consist of independent observation.
If we assume (a) serum cholesterol is
Want to see the full answer?
Check out a sample textbook solution
Chapter 8 Solutions
Fundamentals of Biostatistics


- What is meant by the sample space of an experiment?arrow_forwardWhat is an experiment?arrow_forwardA sociologist wants to investigate the question, "Is there a relationship between texting during class and grade-point-average (GPA) among high school seniors in a large district?" Which study design is most appropriate? Before the semester starts, randomly select 40 seniors from each high school who do not text during class. Assign 20 to the texting treatment group (text three or more times during every class meeting) and 20 to the control group (no texting during class). At the end of the semester, obtain each student’s GPA from the appropriate admissions and records office. Compare the GPA of students who routinely text during class to the GPA of students who do not text during class. Before the semester starts, randomly select 40 seniors from each high school who do not text during class. Assign 20 to the texting treatment group (text three or more times during every class meeting) and 20 to the control group (no texting during class). At the end of the semester,…arrow_forward
- An important issue is whether there are racial differences in hypertension among children. We define hypertension as being above the 95th percentile for either systolic blood pressure (SBP) or diastolic blood pressure (DBP) among children of the same age, height, and sex. Since some of the children were observed at multiple visits, a GEE model was run of hypertension on ethnic group. There were three ethnic groups considered: Caucasian, African American, and Hispanic. One issue is that BMI, which may vary among ethnic groups, is positively related to hypertension. Hence, a logistic regression model was run, as shown in Table 13.55. 13.89 What is the estimated OR for hypertension comparing Hispanic boys vs. Caucasian boys based on the results in Table 13.55? (Call this OR2 .) Provide a 95% CI for this estimate. 13.90 Suppose the average BMI of Hispanic boys is higher than that for Caucasian boys. Is BMI a confounder of the association between ethnic group and hypertension? If so, is it…arrow_forwardThe Joint Commission on Accreditation of Healthcare Organizations mandated that hospitals ban smoking by 1994. To study the effects of this ban on smoking behaviors, subjects were randomly selected from two different populations: those from hospitals with the ban and those from hospitals without the ban. Investigators were interested in determining if this smoking ban had any impact on the proportion of smokers employed at each hospital that then quit smoking. Let px be the proportion of smokers from hospitals that implemented the ban who quit smoking during the study period. Let py be the proportions of smokers from hospitals without the ban who quit smoking during the study period. Please select the appropriate hypotheses. H0: px = 0.50 HA: px ≠ 0.50 H0: px-py ≥ 0 HA: px-py H0: px-py ≤ 0 HA: px-py > 0 H0: px-py = 0 HA: px-py ≠ 0arrow_forwardA group of students in Methods of Social Research wanted to study the relationship between GPA and participation in athletics among ENC traditional undergraduates. Other researchers have found that students involved in Division III athletics often have higher GPAs than the rest of the student body, so the group of students in Methods wanted to know whether this was true for ENC students. They were able to gather data on 160 ENC students (80 athletes and 80 non-athletes) and found that, among this group, the 80 athletes had slightly higher GPAs on average than the 80 students who were not athletes. In this study, who makes up the sample? Who makes up the population? Suppose they found in the sample data that the overall GPA for ENC athletes was 3.35 and for the ENC non-athletes was 3.21. Are these statistics or parameters?arrow_forward
- Which of the following best describes what a meta-analysis is. A) Human subjects are chosen and randomized into either an experimental group or a control group. B) An analysis that combines/summarizes the results of several separate but similar studies in order to evaluate results from the combined data. C) A study that is typically performed on animals to understand how chemical components affect our diet and healtharrow_forwardA researcher is interested in exploring the relationship between calcium intake and weight loss. Two different groups, each with 2828 dieters, are chosen for the study. Group A is required to follow a specific diet and exercise regimen, and also take a 500500-mg supplement of calcium each day. Group B is required to follow the same diet and exercise regimen, but with no supplemental calcium. After six months on the program, the members of Group A had lost a mean of 15.215.2 pounds with a standard deviation of 2.52.5 pounds. The members of Group B had lost a mean of 12.312.3 pounds with a standard deviation of 1.91.9 pounds during the same time period. Assume that the population variances are not the same. Construct a 95%95% confidence interval to estimate the true difference between the mean amounts of weight lost by dieters who supplement with calcium and those who do not. Let Population 1 be the amount of weight lost by Group A, who took a 500500-mg supplement of calcium each day,…arrow_forwardIs gender independent of education level ? A random sample of 395 people were surveyed and each person was asked to report the highest education level they obtained .The data that resulted from the survey is summarized in the following table: High School Bachelors Masters PhD. Female 60 54 46 41 Male 40 44 53 57 Question: Are gender and education level dependent at 5percent level of significance ? In other words given the data collected above is there a relationship between the gender of an individual and the level of education that they have obtained ?arrow_forward
- A researcher is interested in exploring the relationship between calcium intake and weight loss. Two different groups, each with 2323 dieters, are chosen for the study. Group A is required to follow a specific diet and exercise regimen, and also take a 500500-mg supplement of calcium each day. Group B is required to follow the same diet and exercise regimen, but with no supplemental calcium. After six months on the program, the members of Group A had lost a mean of 15.8 pounds with a standard deviation of 1.9 pounds. The members of Group B had lost a mean of 16.6 pounds with a standard deviation of 1.4 pounds during the same time period. Assume that the population variances are not the same. Construct a 99% confidence interval to estimate the true difference between the mean amounts of weight lost by dieters who supplement with calcium and those who do not. Let Population 1 be the amount of weight lost by Group A, who took a 500-mg supplement of calcium each day, and let Population 2…arrow_forwardWe are interested in analysing the effect of the lockout laws introduced in some areas of the Sydney CBD and nearby surrounds on the number of alcohol-related violent incidents. Suppose we have two samples of data on the number of violent incidents in a number of local areas of the Sydney CBD and nearby surrounds. Pubs, hotels and clubs located in a subset of these areas became subject to the lockout laws when they were introduced in 2014. The first sample is from 2010 before the introduction of the lockout laws, and the second is from 2015 after the introduction of the law. The hypothesis we wish to test is that the introduction of the lockout laws reduces violent incidents in the areas in which the lockout laws were put in place. We use a difference-in-difference model on the pooled data from 2010 and 2015. We find the following results: viol_inc hat = 33.21 (5.29) + 12.43lockout (7.01) – 4.19Yr2015 (2.98) – 3.32 (lockout x Yr2015) (1.85) N = 181, R^2 = 0.128 Where: viol_incis the…arrow_forwardIn a study of violent victimization of women and men, Porcerelli et al. (A-2) collected information from 679 women and 345 men aged 18 to 64 years at several family practice centers in the metropolitan Detroit area. Patients filled out a health history questionnaire that included a question about victimization. The following table shows the sample subjects cross-classified by sex and the type of violent victimization reported. The victimization categories are defined as no victimization, partner victimization (and not by others), victimization by persons other than partners (friends, family members, or strangers), and those who reported multiple victimization. No Victimization Partners Nonpartners Multiple Victimization Total Women 611 34 16 18 679 Men 308 10 17 10 345 Total 919 44 33 28 1024 Source: Data provided courtesy of John H. Porcerelli, Ph.D., Rosemary Cogan, Ph.D. (a) Suppose we pick a subject at random from this group. What is the probability that this subject will be a…arrow_forward
 Calculus For The Life SciencesCalculusISBN:9780321964038Author:GREENWELL, Raymond N., RITCHEY, Nathan P., Lial, Margaret L.Publisher:Pearson Addison Wesley,
 Big Ideas Math A Bridge To Success Algebra 1: Stu...AlgebraISBN:9781680331141Author:HOUGHTON MIFFLIN HARCOURTPublisher:Houghton Mifflin Harcourt
 Glencoe Algebra 1, Student Edition, 9780079039897...AlgebraISBN:9780079039897Author:CarterPublisher:McGraw Hill
 College Algebra (MindTap Course List)AlgebraISBN:9781305652231Author:R. David Gustafson, Jeff HughesPublisher:Cengage Learning